Author: Jin Seo
-
8. Re..rerouting…
Last week, I noticed that my practice is kinda surrounded by the concept of navigation as a controlled sytem that directs bodies towards intended directions.
I started to do more indept research about navigation and realised Navigation is always followed by movement. Through navigation, movement becomes a process across both time and space, what Adesola Akinleye describes as a form of “four-dimensional distance.” During Unit 2, I began investigating how graphic communication design could use movement to engage with heritage as an active process rather than a fixed historical subject.
I explored my personal family archive, the historical context surrounding it, and the recorded and unrecorded stories of Korean historical figures through different navigational systems: exhibitions, archives, books, captions, and moving image.
Rather than treating these as separate media, I became interested in synthesising them into one continuous movement condition, GPS, exhibition circulation, unfolding books, editing timelines, and audience movement all functioning as connected forms of navigation.
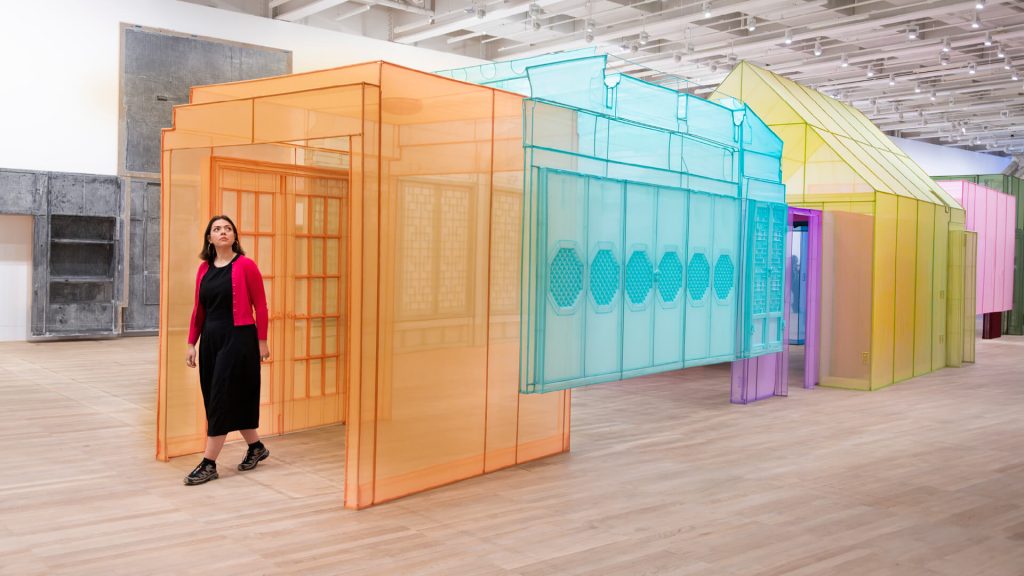
This approach was influenced by artists such as Do Ho Suh, whose work reconstructs home not through fixed representation, but through embodied navigation and spatial memory.
Also, based on the last week’s feedback on the physical and emotional experience for the audience to experience the distance of memory, absence, and historical fragmentation, I started to think about making physical space that explores how bodies are guided through institutional systems and how audiences might reclaim agency by rerouting themselves through alternative historical paths.
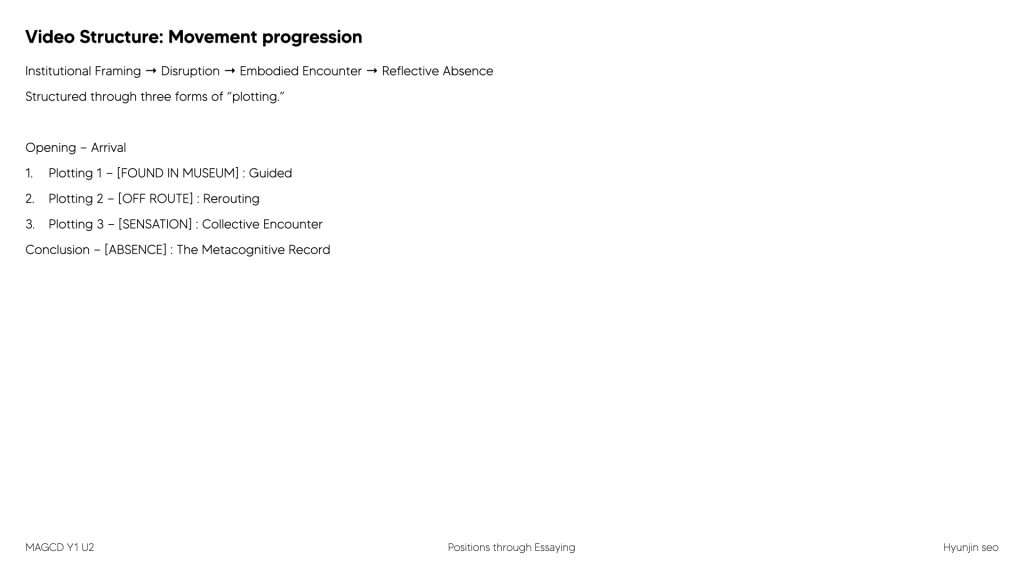
The structure of the video follows a movement progression:
Rather than designing an informational experience, I wanted to design what I describe as an affective navigation condition, a system that changes the audience’s bodily and emotional relationship to history.
The project is structured through three forms of “plotting.” Rather than presenting a fixed narrative, plotting allows me to stage navigable relationships between fragments, voices, spaces, and movements. The focus is not simply what the audience sees, but what state they enter while moving through the work.
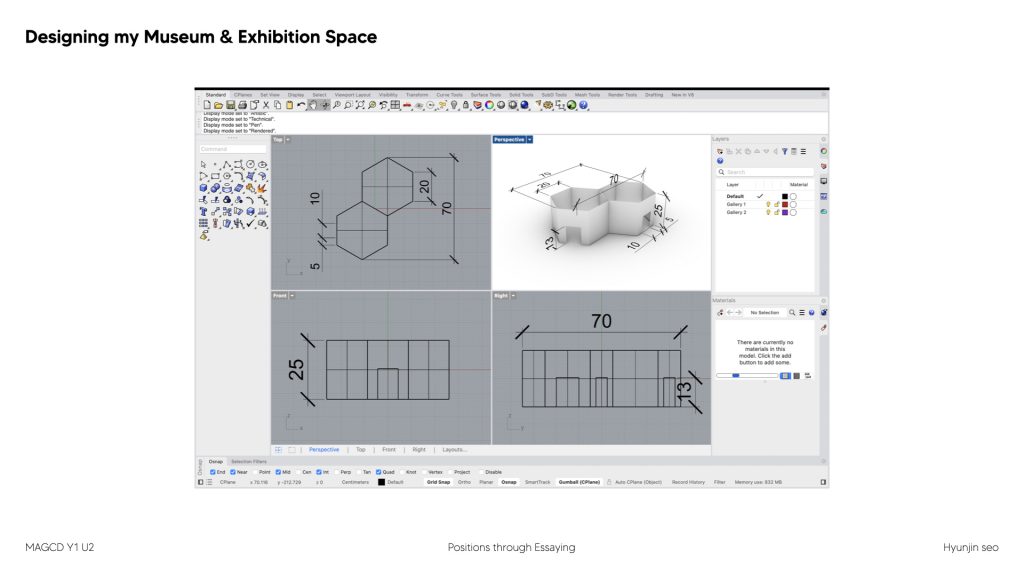
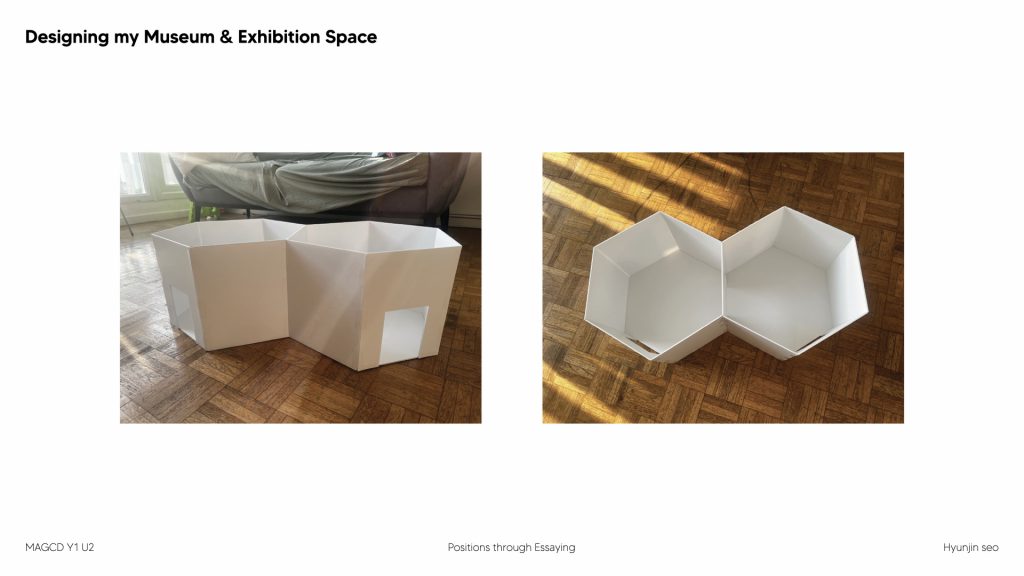
Then, I started to Design my museum and exhibition space.
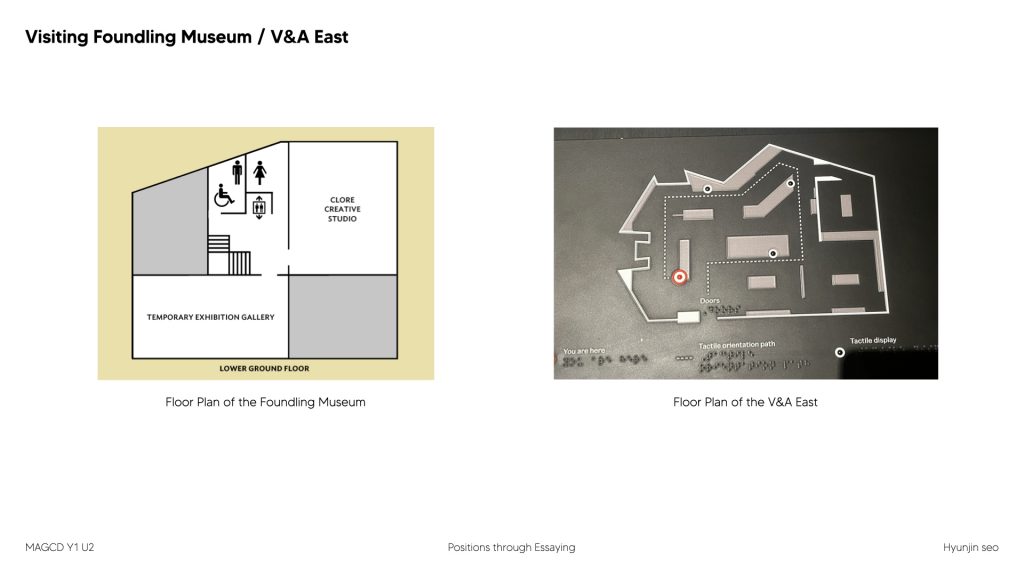
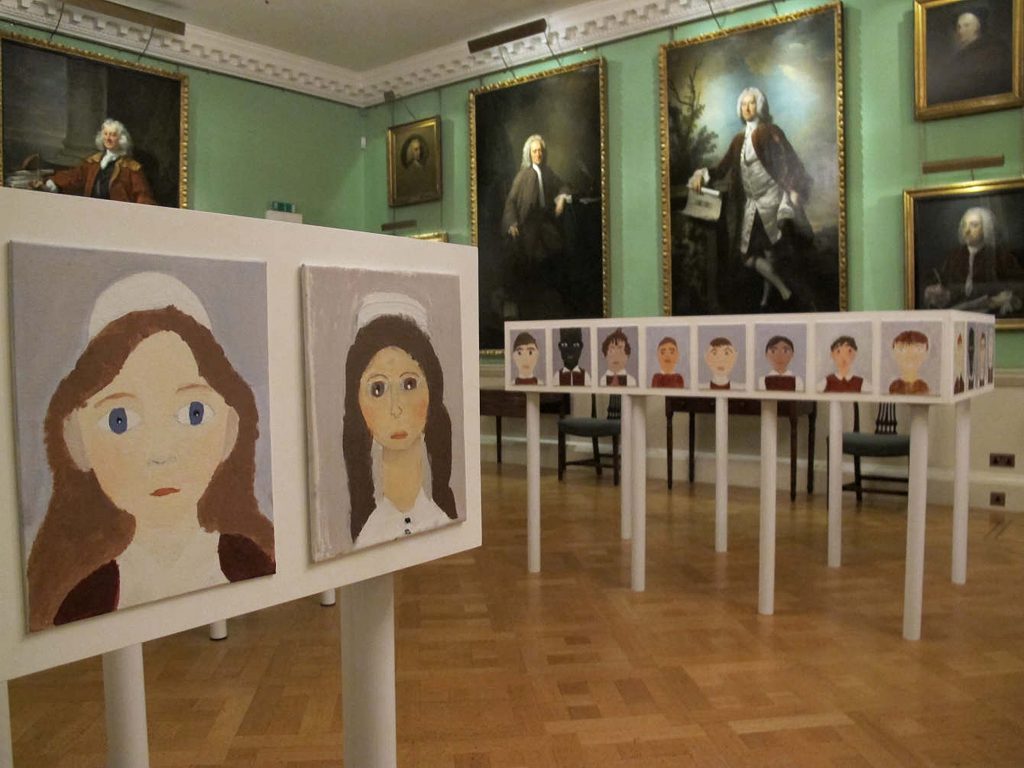
I Visited Foundling Museum, V&A East to Look at the their floor plan and started to develop mine.
I started to think about how my project began from Babel of library’s room. Using that as the base I started to develop some mockups. I used 3D Rhino to digitally sketch them and then cut out cardboards to build the museum space.
Refined Video Structure
Opening — Arrival
The video begins with a definition of navigation
Navigation search to the National Memorial of the Korean Provisional Government, the institutional site connected to my great-great-grandfather’s archive and the starting point of the project.
Initially I tried making this opening by navigating audience to the foundling museum.
However, when I talked to Aby, she suggested that the audience should be guided to somewhere incoherent to the subject I am dealing with, people of Korea. Almost like an actual essay briefly informing the audience what will happen in the main body. This made me to shift my Idea and redesign the storyline of the Opening.
Over these images, GPS navigation line (like a car satellite map) is superimposed, guiding a virtual arrow straight down a linear highway.
Exciting Korean show “Walking around the world” trade mark song plays.
Plotting 1 — [FOUND IN MUSEUM] : Guided
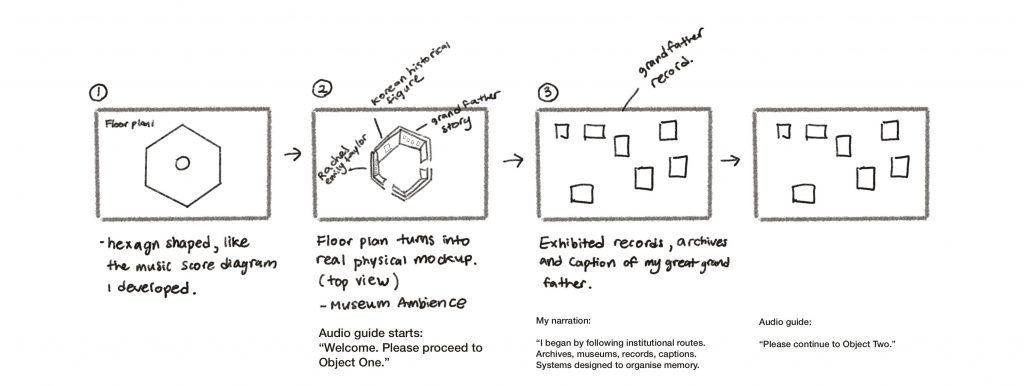
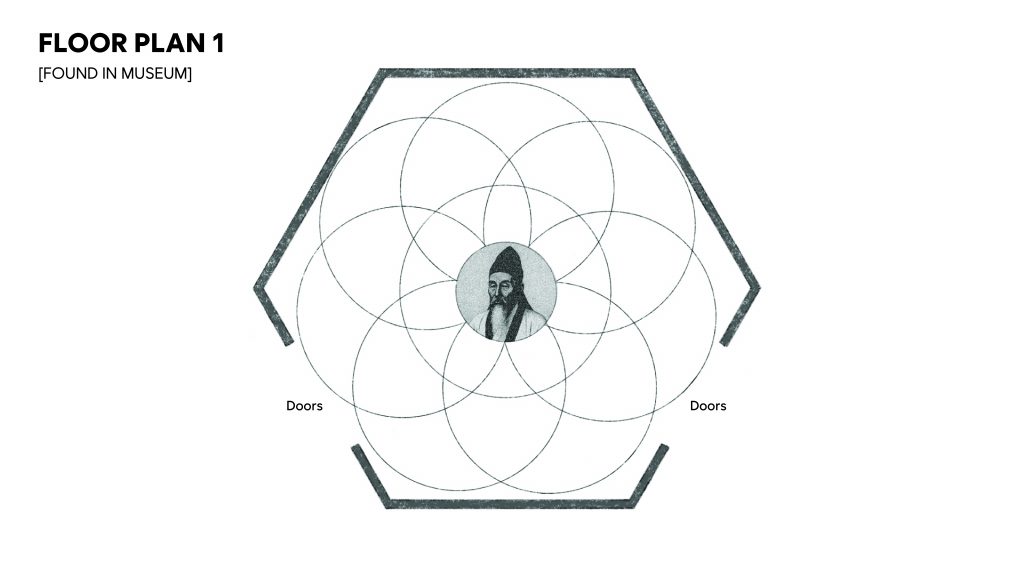
Floor Plan 1 Introduced.
The audience enters the museum through a guided route. Floor plans, archival fragments, captions, and audio guides organise the viewing experience into a coherent historical sequence.
Here, I reference Rachel Emily Taylor and her concept of “heritage as process.” Her work analysing erased voices within museum systems shifted my understanding of heritage away from fixed preservation and towards active reconstruction and audience participation.
This section investigates how museums, archives, and graphic systems flatten historical subjects into controlled narratives.
Plotting 2 — [OFF ROUTE] : Rerouting
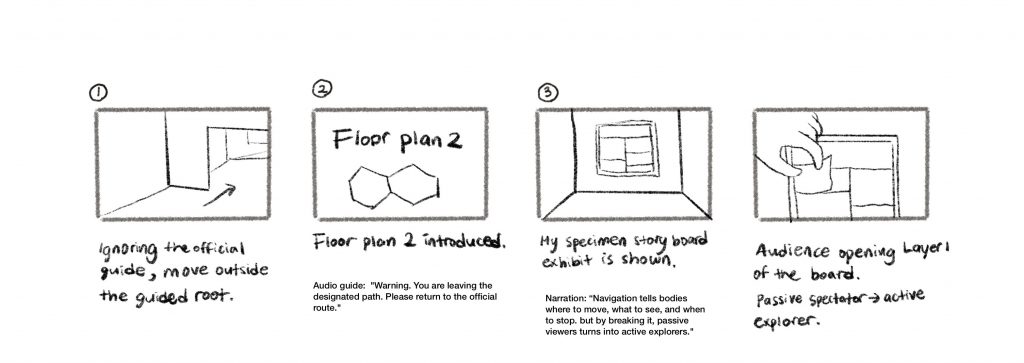
The audience begins ignoring the official audio guide and moves outside the designated exhibition path.
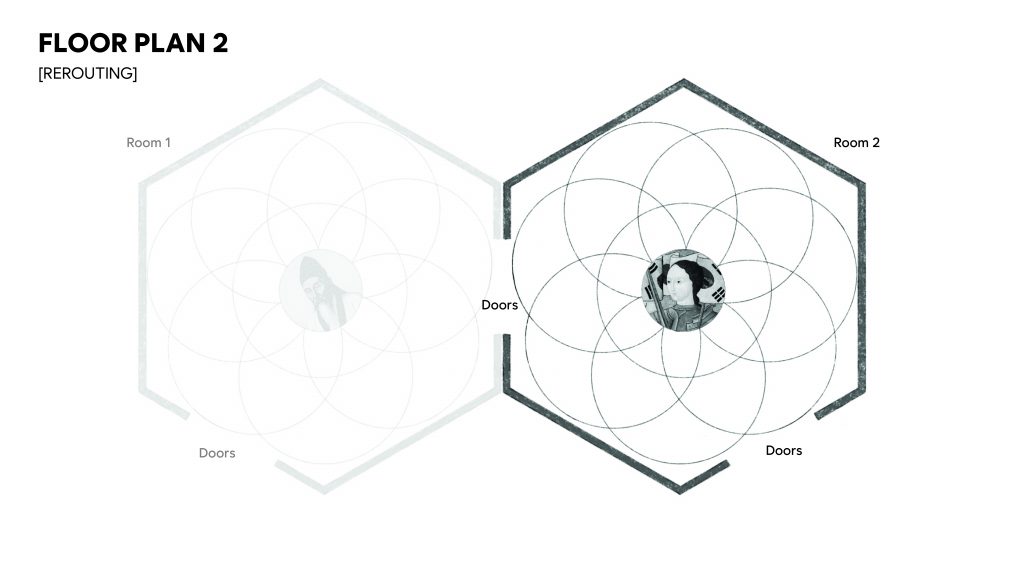
Floor Plan 2 Introduced.
As the guided route breaks down, hidden narratives emerge: untranslated grief, fragmented testimonies, erased historical figures, gravestones, state records, and unofficial archives. The exhibition becomes overloaded and unstable.
This moment transforms the audience from passive spectators into active participants constructing their own relationships between historical fragments. Navigation becomes an act of resistance.
Plotting 3 — [SENSATION] : Collective Encounter
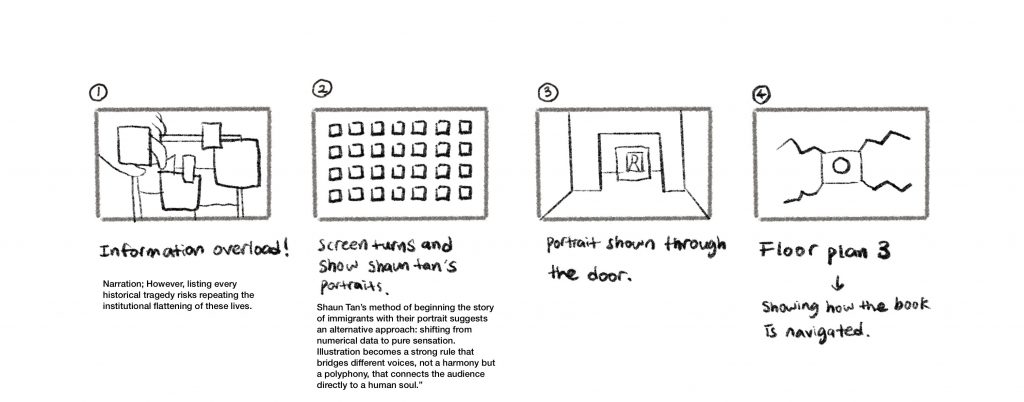
At this stage, I began questioning whether factual information alone could restore human dignity.
Influenced by Shaun Tan and The Arrival, I became interested in portraiture and illustration as a way to create sensory encounters rather than informational summaries. Illustration became a visual structure capable of holding fragmented voices together without flattening them into a single narrative. Through unfolding illustrated portraits, forgotten voices begin emerging beneath institutional surfaces.
Floor plan 3 introduced.
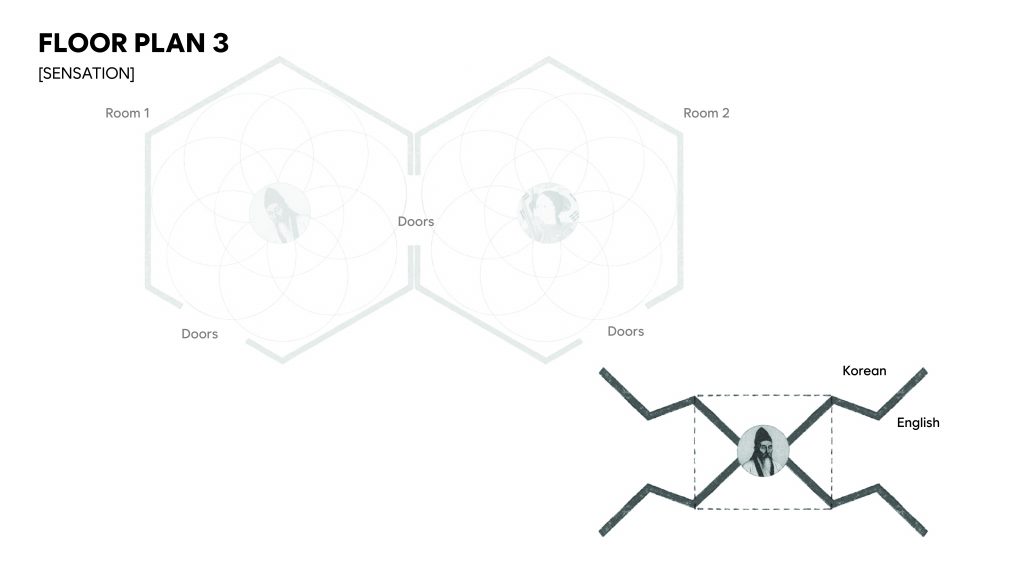
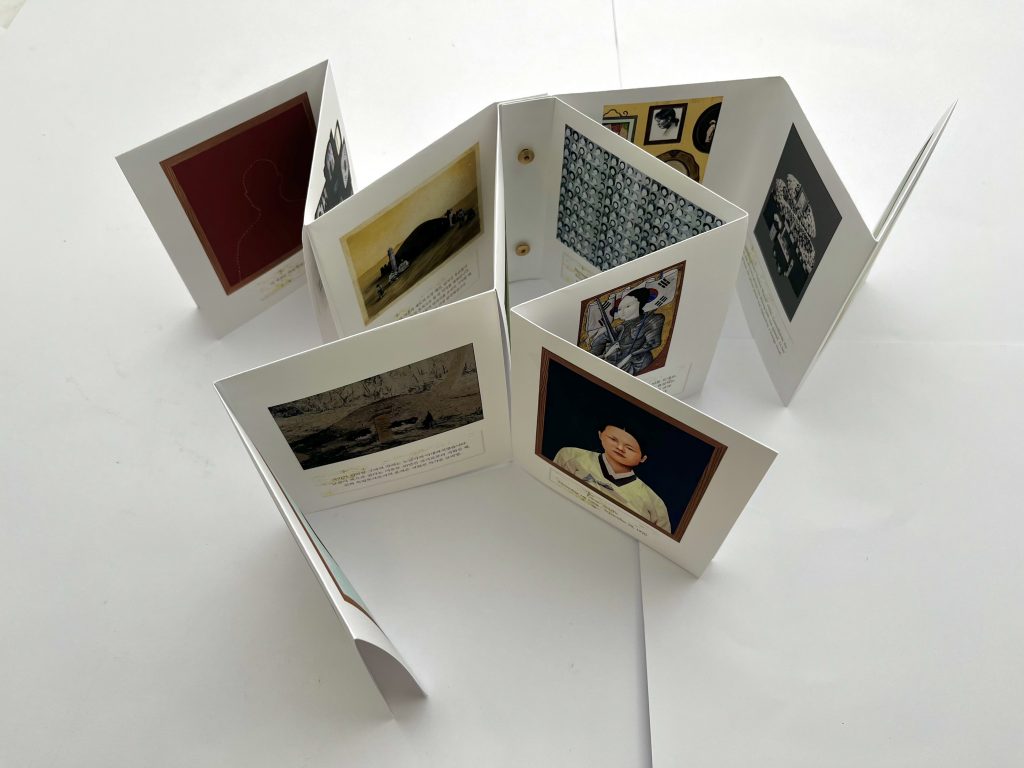
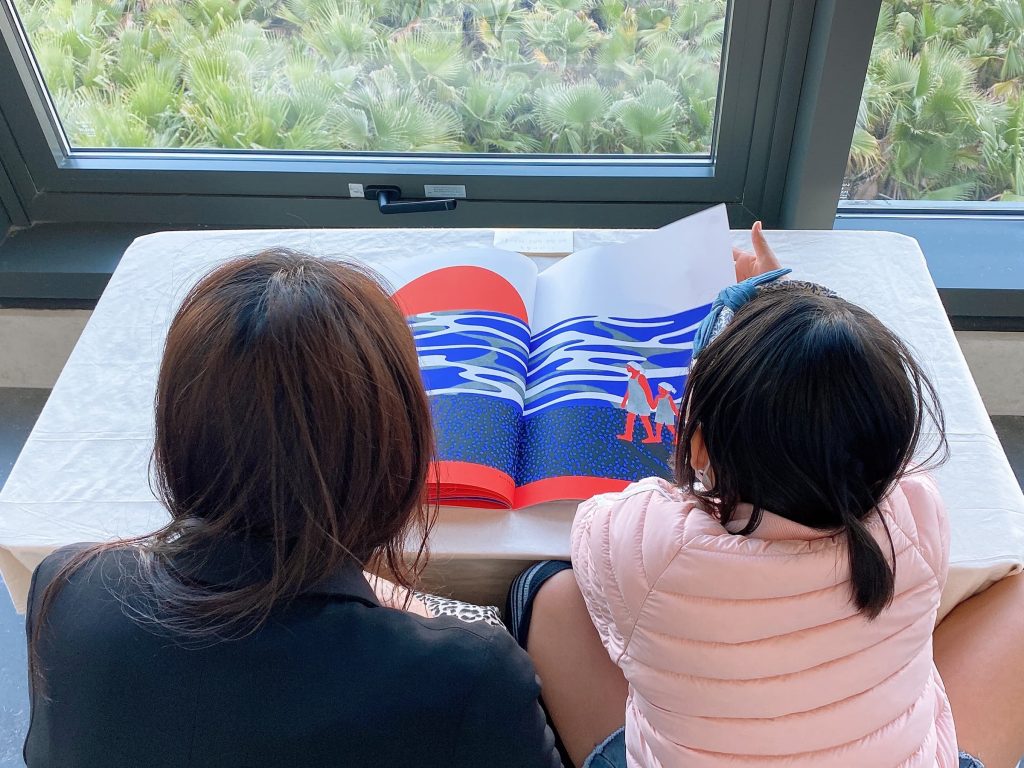
The accordion pocket-book becomes a navigation system itself: closed, it behaves like an institutional display; opened, hidden narratives unfold beneath it.
Conclusion — [ABSENCE] : The Metacognitive Record
The final section reveals the editing timeline of the video itself.
For the first time, the narration uses “I.”
The audience watches clips being rearranged, muted, deleted, and withheld. The editing process becomes visible rather than hidden.
This reflects my own positionality within the work. I realised that I am not a neutral storyteller documenting history objectively. I am actively selecting, organising, framing, and mediating historical fragments.
Institutions often hide their editing processes behind the appearance of neutrality. I wanted to expose mine.
The video ends with absence itself becoming the final record.
“What is not recorded is not absent. Its absence is the record.”
-
7. Navigation
My Unit 2 expended with a question: How can a visual system hold multiple voices, times, and historical positions without collapsing into a single readable narrative.
And, ended with a question: How can graphic communication design resist institutional control of heritage by turning archival silence into an act of reconstruction?
Initially, I approached this through my own family history, 80 fragmented slips of paper belonging to my great-great-grandfather. But through my research, I realised that these fragments were already ‘flattened’ by the languages and administrative formats of colonial and state powers.
Heritage as Process
“Rachel Emily Taylor’s concept of ‘Heritage as Process’ was a turning point. I stopped seeing my work as a static family tree and started seeing it as a political engagement with heritage. I realised that the archive is a site of tension between state protection and institutional control.
Following Shaun Tan’s approach to ‘sensory sensation,’ I decided to focus not on exhaustive data, but on a singular, sensory ‘stab,’ the deep, personal violations that the state’s official vocabulary fails to capture.”
Studio Output: Navigation system to Pocket-Accordion
This led to my physical studio responses:
1. Navigational system: Diagram and Website
2. A ‘Pocket-Accordion’ book.

It uses a three-layer structure to move the audience from the ‘Official Surface’ (Layer 1) to the ‘Distorted Archive’ (Layer 2) and finally to ‘Critical Fabulation’ (Layer 3).
The physical design forces a dual-directional reading; Korean and English audiences unfold the book in opposite directions, reflecting the untranslatable gap in historical responsibility and emotional debt.
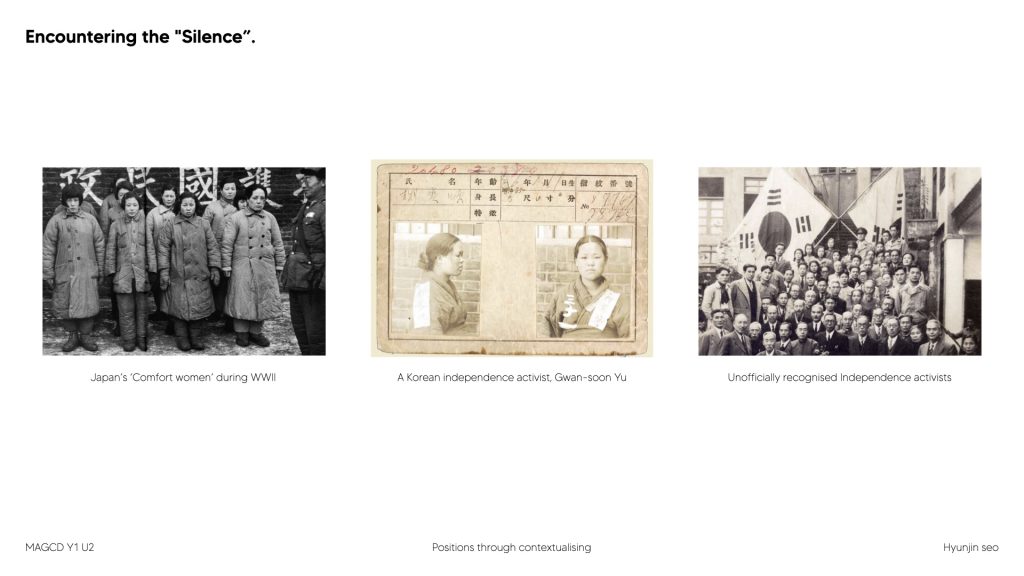
Confronting Feedback: The ‘Political’ & The ‘Silenced Voice’
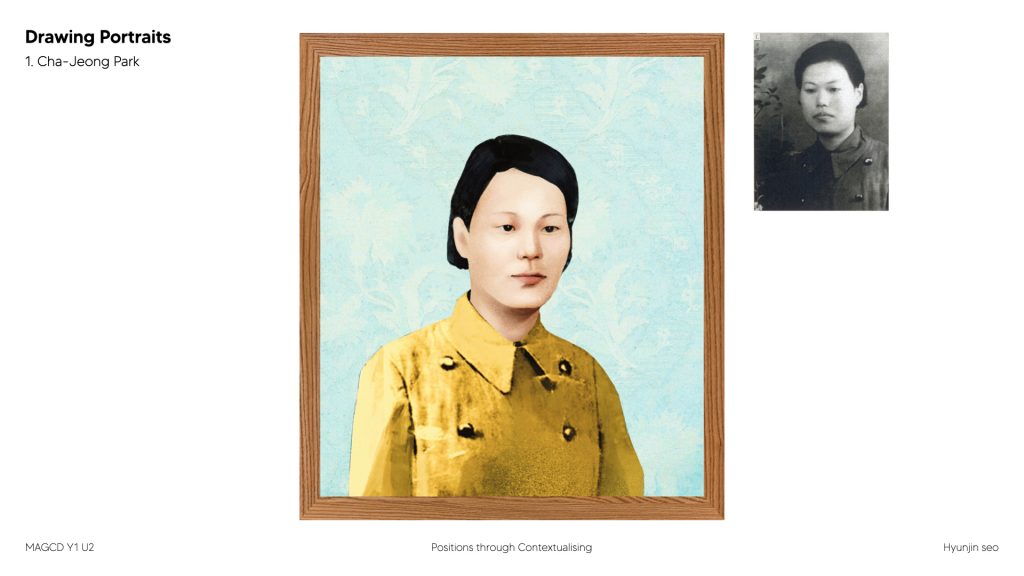
After my contextualising, I realised in overall my work is actually deeply political. And it is. But I started this work from empathy, not politics. The stories I chose, comfort women survivors, Park Cha-jeong, Yu Gwan-sun, activists who refused state recognition, are political because the state made them political. I didn’t.
Also, my attempt to write neutral captions, I had unintentionally silenced my own voice as a designer. I was trying to let the stories speak for themselves. But neutrality is also a position. And mine was disappearing behind it. These two pieces of ideas kinda led me to think about navigation.
Redefining Navigation
Navigation, in its technical definition, is the process of monitoring and controlling the movement of a craft or vehicle from one place to another.
As Adesola Akinleye writes in Navigations: Scoring the Moment — curators, engineers, and architects share a common interest in how we direct bodies in what they see, what they hear, and when they stop or start.
I realised that the state’s official history, the museum’s standard tour route, and the GPS system in your car are structurally identical. All three are invisible control systems designed to be followed without question.
And my book, with its layers, its dual directions, its hidden pocket, is also a navigation system. One that asks the audience to question the route. And i wanted to use my video essay to talk about navigation not as a metaphor, but as the literal form of the work.
So through this video, I wanted to explore graphic communication design as a movement choreography as it is a system that directs bodies to certain direction. Reading, watching artwork, national stories are all navigation and neutrality is in-fact an interface that allow frictionless navigation.
Why am I making what I am making?
Throughout Unit 2, I became interested in understanding heritage not as a fixed historical outcome, but as an active and ongoing process. I also began to see systems not as the core of my practice, but as tools for navigating and revealing hidden narratives.This video became a way of expressing both ideas simultaneously: heritage as process, and navigation itself as a process of questioning, rerouting, and negotiating history. By moving through and against the official navigation system of state-approved history, I wanted to visualise my own act of navigating these stories while encouraging the audience to actively reroute themselves in order to encounter suppressed and erased voices.
Video Essay Concept: Rerouting History
The video essay will be titled ‘Rerouting Navigation.’
It will mimic a car’s GPS system. A cold, mechanical English voice will act as the institutional guide, instructing the audience to ‘Proceed straight on the approved highway of history.’ However, the narrative will be disrupted by a ‘Critical Malfunction,’ the sound of human, Korean voices inside the car deciding to ignore the GPS. ‘The official highway doesn’t have the voices we need,’ they say. ‘Turn the wheel.
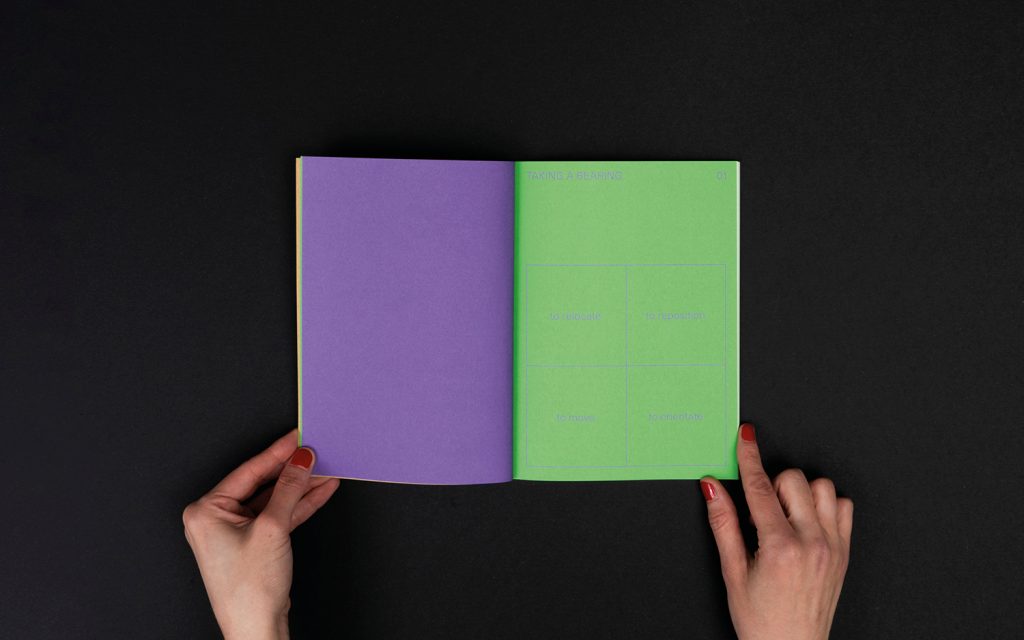
Phase 1: The Functional Interface (0:00 – 0:50)
- The video opens in absolute silence. A screen-recording of Adobe InDesign or Illustrator. The mouse cursor adjustments grids, lines, and folding marks on an accordion layout. Improving the navigation of the book.
- Then, a dictionary definition of “Navigation” fades in over the digital workspace: “Navigation: A field of study that focuses on the process of monitoring and controlling the movement of a craft or vehicle from one place to another.”
Critical Context: It demonstrates that the functionality of reading is also ‘functional navigation’ controlled by the movement path designed by the designer. Showing the journey i took to answer the question of How can I guide the audience through the book without letting them get lost?
Phase 2: The Controlled Heritage (0:50 – 1:40)
- The digital workspace fades out, dissolving into sterile, well-lit museum display cases, official state portraits, and clean administrative archives (Layer 1).
- Over these images, GPS navigation line (like a car satellite map) is superimposed, guiding a virtual arrow straight down a linear highway. The navigation voice continues, but now it’s guiding through history.
- The audience is following a route designed by the state. Without question. Text from Adesola Akinleye’s Navigations emerges as a subtitle:“Curators and engineers share a common interest: how we create movement… how we direct bodies in what they see, what they hear, and when they stop or start.”
Critical Context: audience began to realise that the essence of navigation is about directing the body, where to move, what to look at, and when to stop. This led me to connect the standard viewing routes of museums and officially sanctioned national histories (Layer 1) as forms of carefully controlled navigation systems.
It exposes that while it may appear peaceful like ‘Walking Around the World,’ the nation’s official history and museum tour routes are a massive control system orchestrated to force audience to consume what they intended.
Phase 3: The Critical Malfunction (1:40 – 2:50)
- GPS line suddenly glitches, flickers, and shakes. The sterile museum images fracture into chaotic, overlapping visuals. Raw, unedited Korean voices inside a car): Conversational, human Korean voices cut in, as if we are sitting inside a moving car) ‘이리로가는게맞아?’ ‘지도에는이게전부야.’ ‘근데저기길이또있어.’ ‘경로를이탈했습니다. 재탐색합니다.’
- Layer 2 opens. The cracks appear. Park Cha-jeong’s gravestone. The Catholic funeral that was refused. Three thousand people reduced to a crowd. Korean and English begin to mix.
- 탑승자 A: “이리로 가는 게 맞아? 내비대로 가고 있어?”
- 탑승자 B (디자이너 본인의 생생한 목소리): “아니. 내비가 가라는 고속도로에는 할아버지의 진짜 목소리가 없어. 가부장제가 지워버린 여성들의 이름도, 서류가 없어서 국가가 인정하지 않은 수많은 사람들의 진짜 서사도 다 이 깔끔한 도로 밖에 버려져 있어. 나 내비 무시하고 이 80개 종이 쪼가리 밑으로 갈래. 핸들 꺾어.”
- English GPS Voice (Distant, muffled, panicking): “Rerouting. Make a U-turn into the approved archive. Rerouting…” (The voice snaps off into static)
Critical Context: At this point, the passengers inside the vehicle, the designer and the voices themselves, begin to “reroute.” By refusing the predetermined navigation system (the official national record) and turning instead toward shortcuts and side roads (the 80 fragmented paper pieces and hidden voices), the film shifts from a simple instructional guide into a video essay that creates fractures within the system itself.
Phase 4: Outro (3:30 – 3:50)
- The navigation voice returns. ‘You have arrived at the destination. Navigation Ended.’
- The screen goes dark. Then text appears slowly.
- All navigational techniques involve locating the navigator’s position compared to known locations. What if the location is not on the map? What if it was removed?
- A close-up of one of my great-great-grandfather’s 80 slips of paper.
- ‘This is where it started.’
- The book closes. Screen black.”
- What is not recorded is not absent. Its absence is the record.”
Feedback
- There is something ‘playful’ in my work, maybe show that a bit more?
- Actually adapting or introducing the actual ‘Folding’ somehow.
- Want to see something more ‘Physical.’ My work has a really strong physical element, and the video should show that too.
- Maybe doing an actual mockup of the exhibition space? Current digital visual language does not incorporate my exploration of unit 2 very well.
-
5. The Unfolding Exhibition
Last week’s tutorial, there were three main concerns/ideas raised:
- Problem 1: The Necessity of a Physical Object: A project about “unfolding” couldn’t just remain a flat digital layout or a basic booklet. I needed a physical mechanism where the form itself reflected the tension between state control and personal memory.
- Problem 2: Information Overflow: For instance, in the “Comfort Women” archive, there were too many heavy stories—the denial of a Catholic funeral, the embezzlement of funds, the abandonment of relics. Trying to show everything especially to foreign audience kind of made the narrative feel overwhelming.
- Problem 3: The Divided Audience: Who is this archive for? The background knowledge and emotional baggage of a Korean audience and an international audience are completely different. Korean viewers often feel fatigued by overexposed historical narratives, while international viewers lack the basic historical context entirely.
solution to problem 1&3:
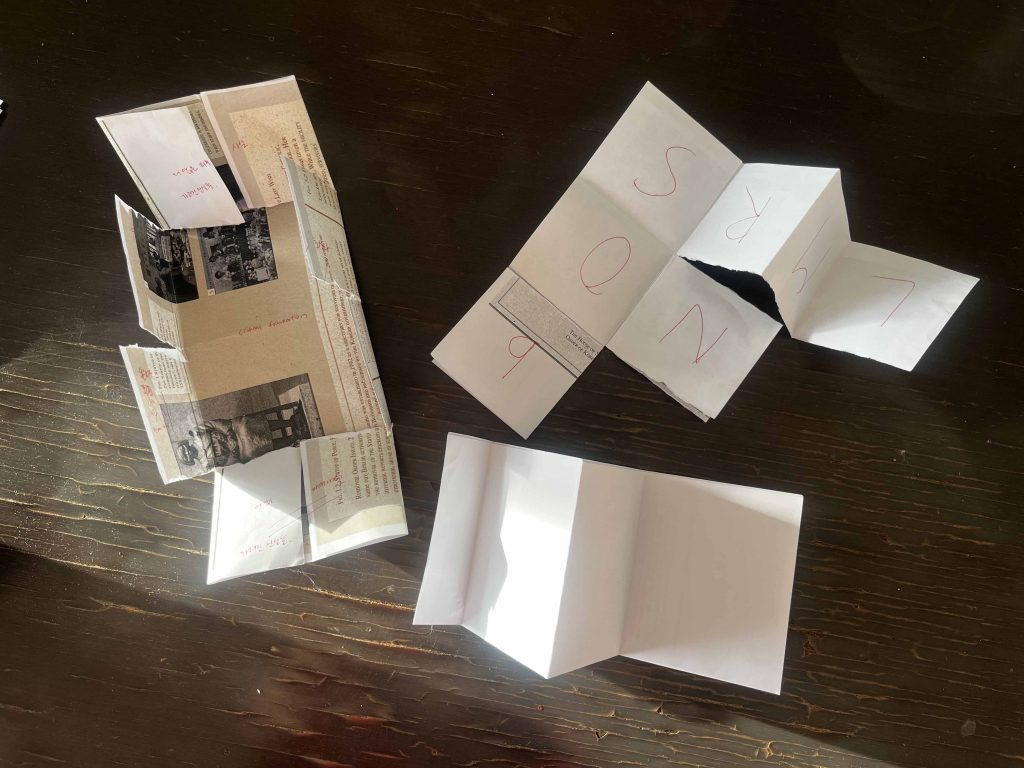
I initially tried different types of according forldings and see what would be the best.
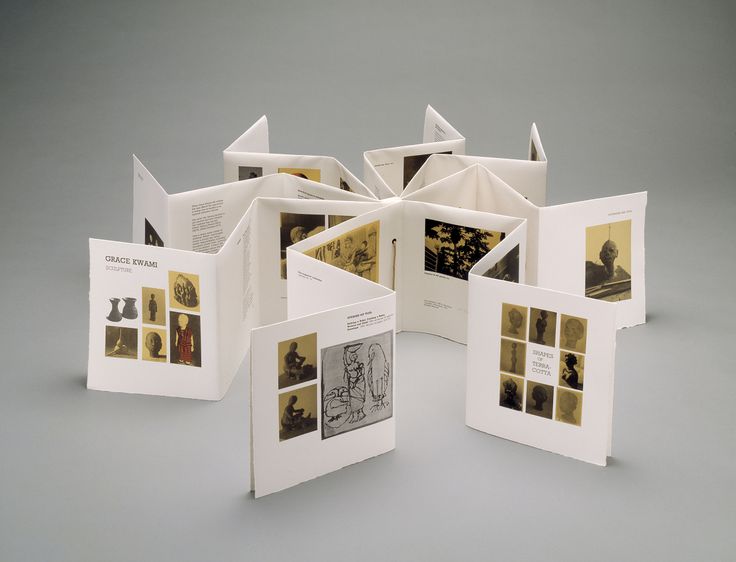
Atta Kwami; Ghana; 1993; Paper, millboard, cloth; H x W x D: 7.5 x 27 x 37.5 cm (2 15/16 x 10 5/8 x 14 3/4 in.); Purchase funds donated by Brian and Diane Leyden but then, i found this project by Atta Kwami’s ‘Grace Kwami Sculpture’, a leporello bound book designed to unfold and stand on its edge. and I thought maybe I can I adapted this into a “Pocket-Accordion” structure.
I started some sketches. I adapted this into my own structure.
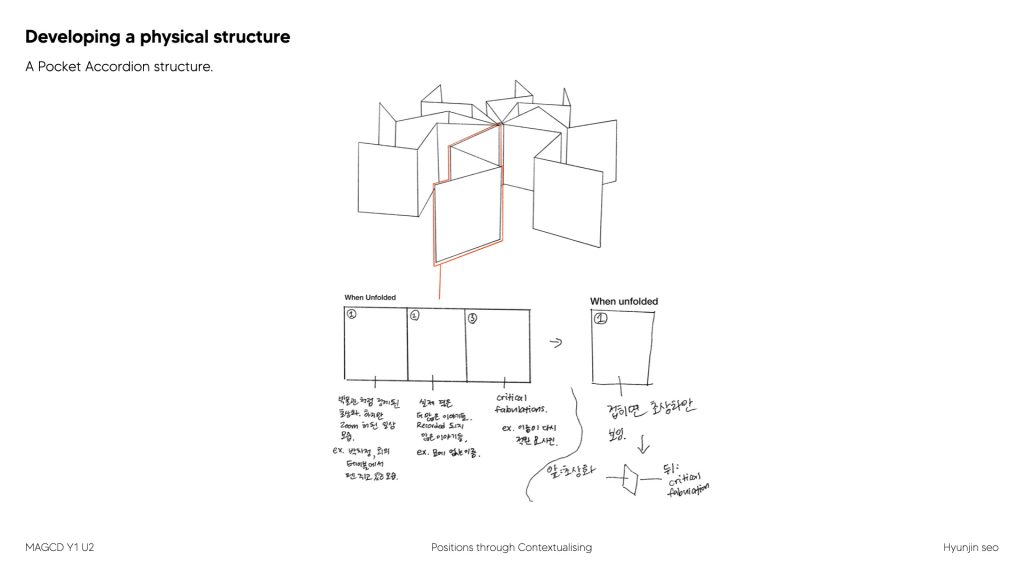
An A3 sheet, folded into a pocket, with specific creases cut so that the book can only be fully read from one direction at a time. When closed, it feels cold and rigid, like a museum specimen box. But when unfolded, three layers of truth emerge. The single sheet of paper represents the oneness of the archive, but the folds create multiplicity. it kinda responds to my enquiry as the paper resists being opened, just as the institution resists being questioned.
- Layer 1: The official surface. State-approved portraits and formal captions. Authoritative. Complete.
- Layer 2: The distorted archive. The same people, but now the cracks begin to show. What the institution silenced.
- Layer 3: Critical Fabulation. Based on Saidiya Hartman’s idea of filling the gaps with imagination, but never hiding that it is imagination. A restorative space created by the designer, not a discovered fact.
Critical Positionality of the Structure
This physical limitation became a conceptual strength. The book can only be read from one direction at a time.
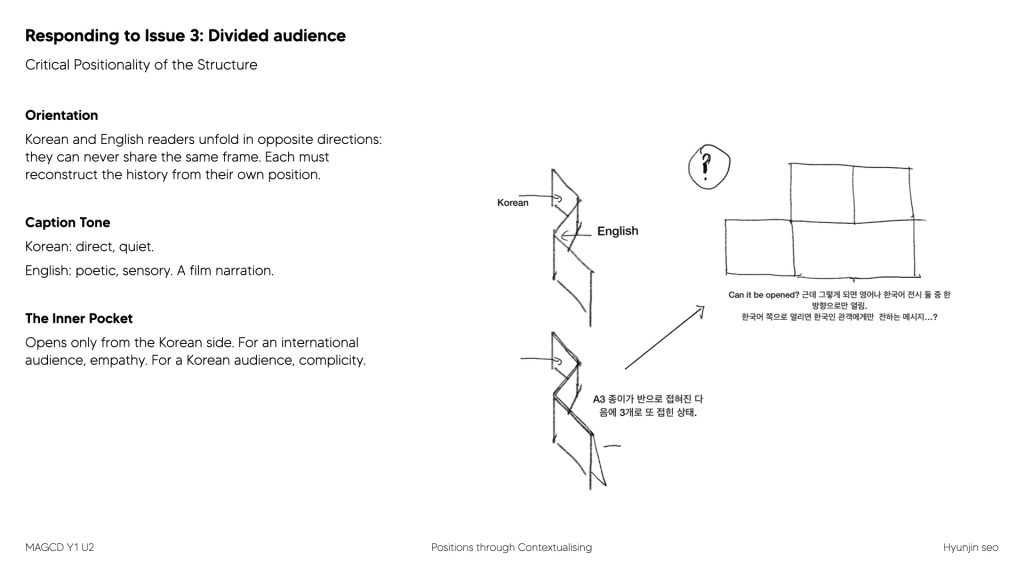
Korean and English readers unfold the book in opposite directions. They can never share the same frame. Each must reconstruct the history from their own position.
And the captions are different too, not just in language, but in role. Korean captions speak directly, quietly, like someone whispering something you already knew but chose to forget. English captions are like a film narration.
At this point, I decided the inner pocket opens only from the Korean side. Because the weight of responsibility is different. For an international audience, this is a universal human rights issue, empathy. But for a Korean audience, we are the accomplices. We allowed this state violence to be silenced. The inner pocket contains what cannot be translated, a private space that resists the institution’s power.
Solution to Problem 2:
Last week’s feedback raised the issue of information overflow. Too many heavy stories at once. I spoke with the curation team at the museum about this.
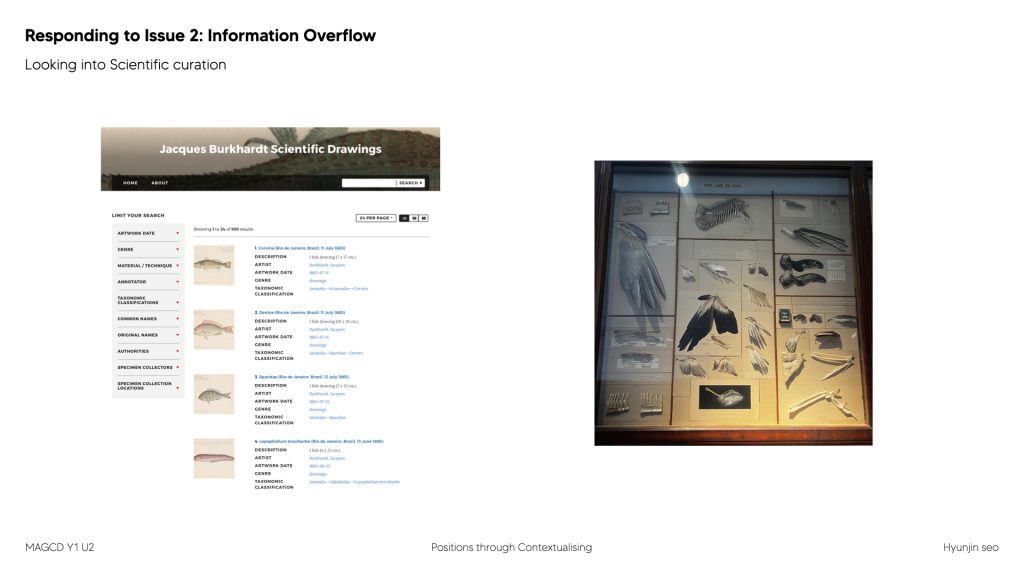
Scientific curation aims for classification and preservation, erasing the curator’s voice to appear objective. Like Louis Agassiz’s fish catalogue. but Art curation, as Rachel says, is about looking after, keeping the context alive.
Then I looked at Shaun Tan’s The Arrival.
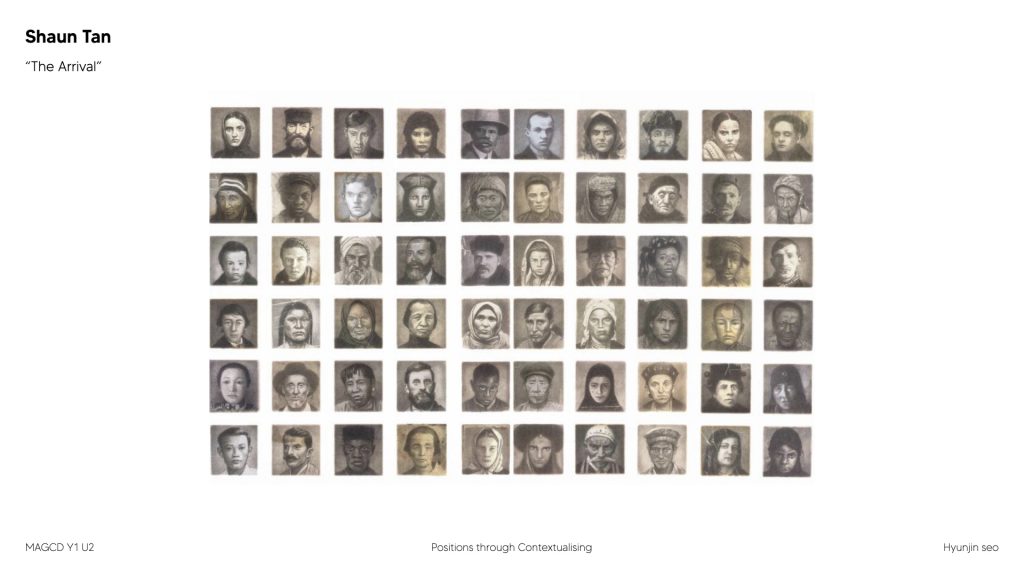
It starts with portraits of immigrants at the very start of the book and then open up the story of Four or five different immigrant stories. No words at all. And yet it never feels overwhelming. Because Shaun Tan doesn’t give information. He gives sensation. You don’t need the historical context to feel the human soul.
This led me to use my drawing style as a bridge. Instead of displaying full information on layer 1 surface, maybe I can draw their portraits, the formal “Official National Portrait”, Like the specimens in the display case and making audience to feel and experience the ‘exhibition’ all align as human story, but then layer 2 opens.
Information Compression: I realised that listing every tragedy (embezzlement, relics, funerals) was just repeating the same sentence: “They controlled us in the name of protection.” Like Shaun Tan, I decided to focus on one singular, sensory event of person or story, for example the denial of the Catholic funeral.
This one deep “stab” is more powerful than a list of administrative complaints. It allows the audience to perform their own critical fabulation by filling in the gaps.
Typography
For typography I used Nanumyethangeul, which is given out by korean heritage foundation to keep the old korean hand writing.
The creators of this font wanted to ensure that the ‘original forms’ of our language are not forgotten. By applying this to my project, the typography itself becomes an act of archiving. It allows me to use the very tool of our cultural heritage to restore the voices that were silenced by the state. It is not just text; it is a digital monument to the language of our ancestors.
The Four Stories
So the book contains four panels.
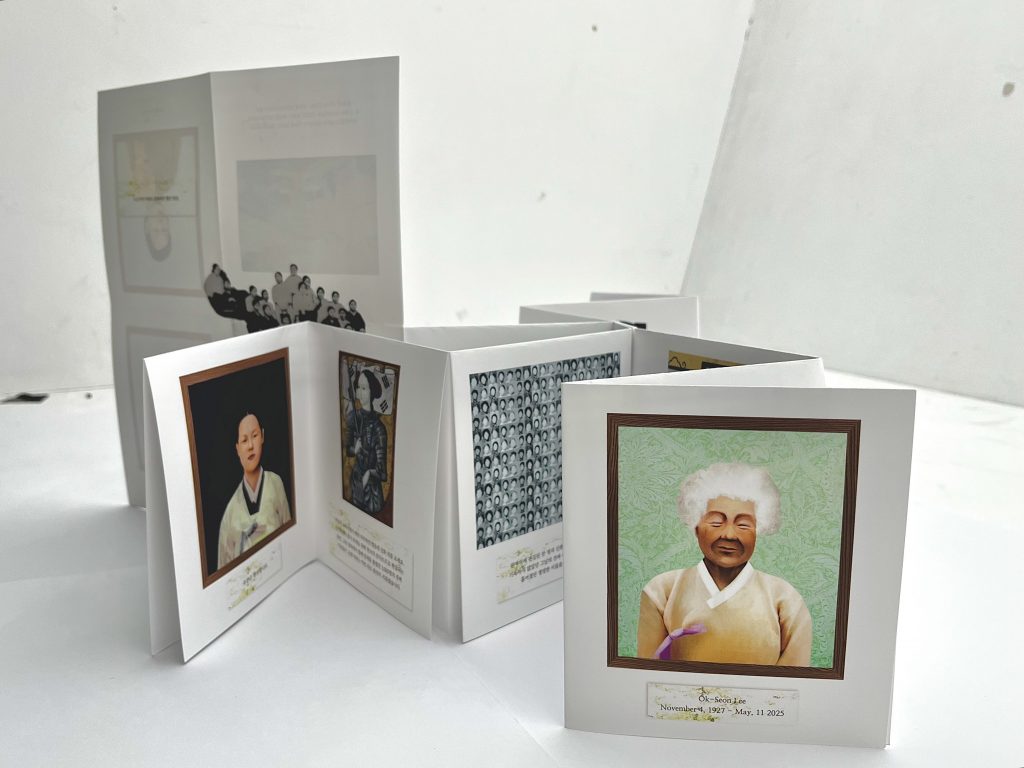
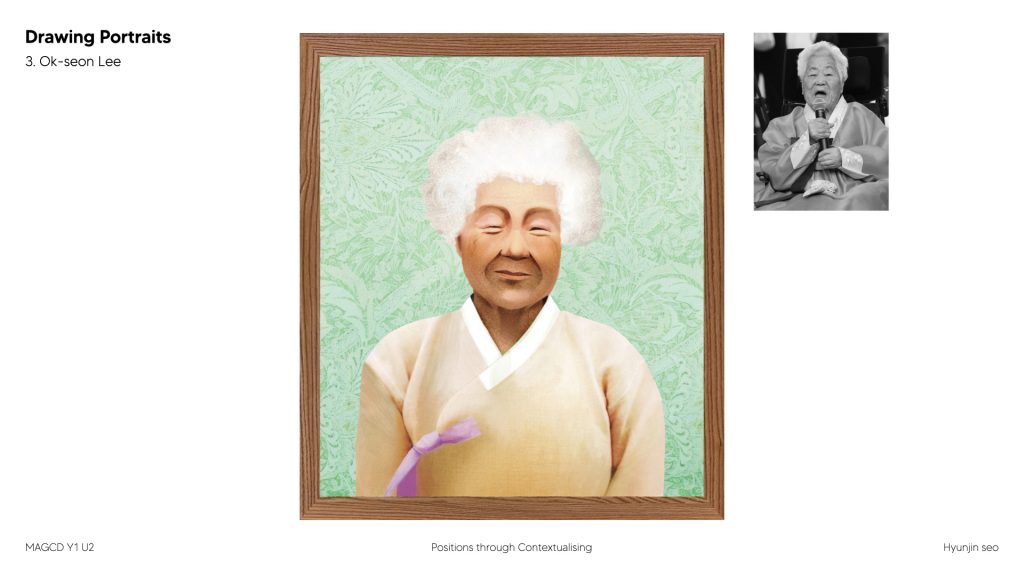
- The first is Lee Ok-seon, a comfort women survivor.
Her portrait smiles. Open the fold, and her lifelong Catholic faith was replaced, at the moment of her death, by a Buddhist ceremony decided by others. Open further, and you see the life she should have had. A quiet room. Photographs on the wall. Ordinary warmth she was never allowed to keep. - The second is Park Cha-jeong. Her portrait is steady and clear. Open the fold, and her gravestone does not carry her name as an activist. It reads: Wife of General Kim Won-bong. Open further, and you see the gravestone that should have existed. Her name, alone, carved clearly.
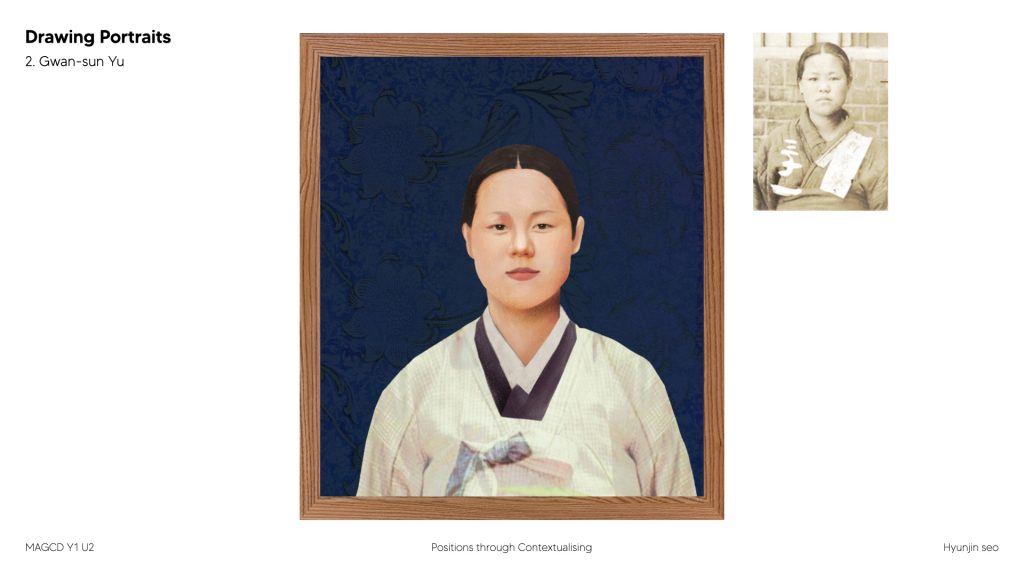
- The third is Yu Gwan-sun. The most perfectly flattened figure in Korean history. Open the fold, and she was virtually unknown before liberation. She was selected for the textbook because someone needed a Korean Joan of Arc. Her image was weaponised by the Park Chung-hee regime. On the day of her protest, there were 3,000 people at Aunae Marketplace. One name was recorded. The rest became a crowd. Open further, and you see those 3,000 faces. Unnamed. But there.
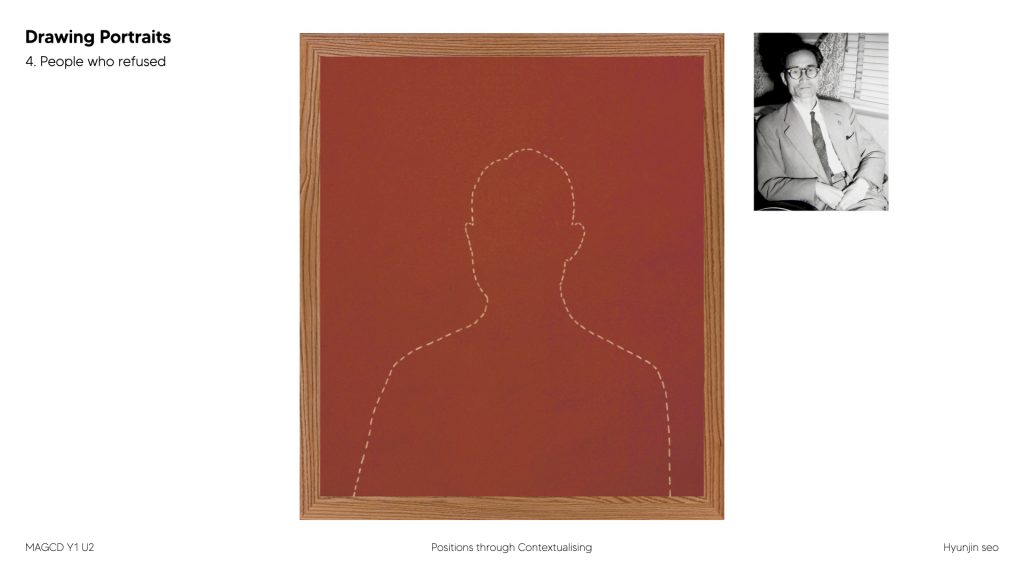
- The fourth panel is empty. A portrait frame with no one inside. Because the fourth story belongs to those who refused to be recognised — independence activists who rejected state medals because they would not let the Park Chung-hee regime, built on a foundation of collaboration, decide what their resistance was worth. Open the fold, and you find the administrative machinery of recognition. Open further, and the empty chair remains. The absence is not a mistake. It is the loudest thing in the room.
The most officially presented things erase the most.
A museum case pins a living thing behind glass and calls it preservation. A national curriculum selects one name from three thousand and calls it history. A sanctuary takes in survivors and calls it protection.
My work asks the audience to open the case. To unfold the surface. To find what was placed underneath, not by accident, but by choice.
The act of folding is the point at which graphic design stops being a tool of flattening, and becomes an act of resistance.
What is not recorded is not absent. Its absence is the record.
-
4. To curate, means to look after
What I realised during Positions Through Iterating was that I enjoy assembling fragmented stories to construct new forms of narrative.
At first, I thought the system itself was becoming the core of my practice. I built structures, rules, and iterative frameworks to hold multiple perspectives together.
But eventually I realised something important: the system is not the centre of my practice. I am interested in systems as tools for storytelling, as conditions that allow hidden or flattened stories to emerge.
As I researched further, I realised that what I thought was a family story was actually something larger. It was about heritage, and specifically, about how heritage is made.
I looked at references like:
- Rachel Emily Taylor — Heritage As Process: Constructing The Historical Child’s Voice Through Art Practice.
Based at the Foundling Museum, the project critiques how children’s histories are often told through adult voices. It identifies a key issue: children are largely voiceless in museum narratives, as history is preserved by adults for them. Using art practice as a method, Taylor reconstructs the child’s voice through workshops involving role-play, empathy, and making. The outcomes are tested through curated artworks within the museum and explores how museums can move from singular, institutional narratives to multiple, coexisting voices, and proposes art as a tool to reframe historical voice and agency. - Yeni Kim — Tamnarok: The Record of Tamna.
A practice-based research project exploring illustration as a tool to manifest intangible cultural heritage, focused on endangered cultural forms: Haenyeo 해녀 and the Jeju language 제주방언. She identifies a generational gap, cultural knowledge is fading due to disengagement of younger generations, and positions illustration as a method to examine lived experience and activate cultural understanding. Her methods include drawing during interviews to visualise verbal narratives, workshops with children to deepen engagement, and translating outcomes into a picture book using the Jeju language. The work demonstrates illustration as a generative, not just representational, tool, sustaining culture as lived and living, not fixed or archived. - Do Ho Suh — Walk the House.
Suh explores home, identity, and memory through installations, drawings, and video, rooted in the Hanok, the Korean traditional house, a structure that can be disassembled and relocated, symbolising mobility and migration. His ongoing Bridge Project investigates the idea of a “perfect home” intersecting with social, political, and ecological realities. Themes of migration, displacement, and memory extend beyond national boundaries, using personal experience to trigger collective resonance. The work demonstrates how private stories can become shared experiences, and actively encourages audience participation through memory recall.
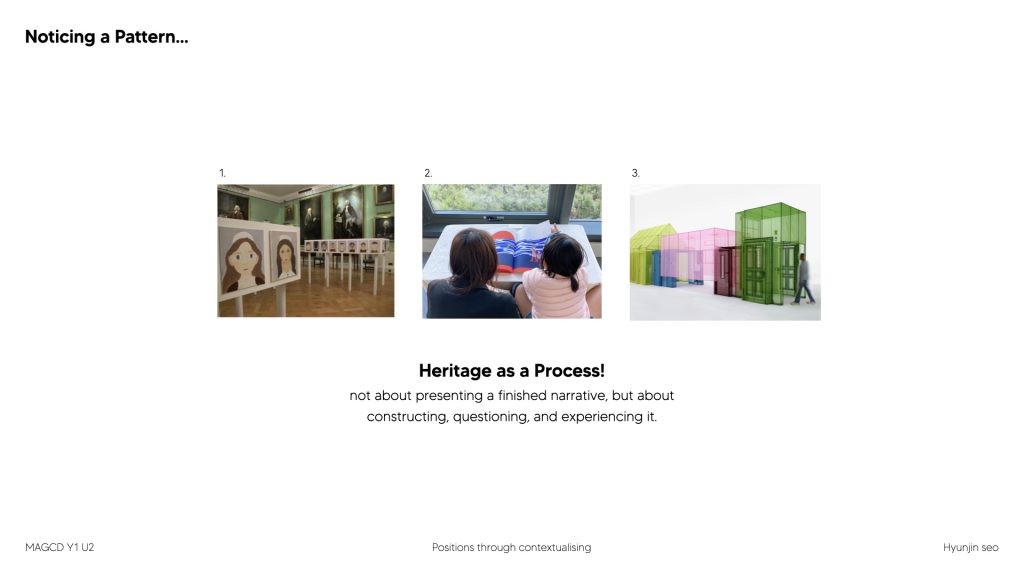
All of them approached heritage not as a fixed subject, but as a process, through participation, making, and engagement. Their work wasn’t about presenting a finished narrative. It was about constructing, questioning, and experiencing. And I realised I was doing the same thing. But with difference. They worked within institutional frameworks. I wanted to break them.
This made me realise that my work, which I had previously thought of as simply a “family story,” is in fact dealing with heritage, specifically, heritage as a process. This explains the tension I had been experiencing between emotion and logic, between storytelling and system. Heritage itself exists within this tension. It is shaped by preservation and control, but also by memory, emotion, and interpretation.
At first, I wanted to explore this through DNA as a metaphor for inherited memory and transmission. But I realised that I was already dealing with histories that were incredibly dense and difficult. Adding another scientific framework risked distancing the work even further. So instead, I decided to empty my head and return to something more direct: my own heritage, my family history, and the structures surrounding it.
Every document left behind by independence activists, including my great-great-grandfather, was written by someone else. Korean, Japanese, Chinese, descendants. The activists’ own voices are absent. What remains are fragments: pieces of paper, in different languages, shaped by different political conditions.
And this is not just a problem of the past. After liberation, the Korean state continued to choose which stories to keep and which to erase.
Socialist activists were excluded due to Cold War politics. Women’s contributions were recorded only as supporting their husbands. Survivors like the comfort women grandmothers were officially commemorated — and simultaneously controlled. The archive was never neutral. It was always already a form of power.
This led me to my critical enquiry:
How can graphic communication design resist institutional control of heritage by turning archival silence into an act of reconstruction?
And my positionality:As both a granddaughter descended from the subject and a graphic designer assembling fragmented archives, I occupy a dual position, simultaneously inside the inheritance and outside the historical record, making my act of reconstruction neither neutral nor complete.
Responding Prompt 3: Translate the reference into a new medium in order to introduce it into a different (but specific) context. Consider various methods of translation, such as: copying, parodying, relaying, interjecting, extrapolating, hybridizing, paraphrasing, etc.
For Prompt 3, I translated Rachel Emily Taylor’s methodology into a new medium and a new context.
Rachel’s starting point was the museum caption. She worked within the institution, restoring unheard voices through workshops, then re-curating them back into the museum space. She resisted from inside the frame. I wanted to break the frame itself.
Rachel uses the Scottish definition of curating — to look after.
My version of curating is also to look after — but in the sense of to look after what has been left behind, to search for, uncover, and reveal. To find what the institution chose not to keep.
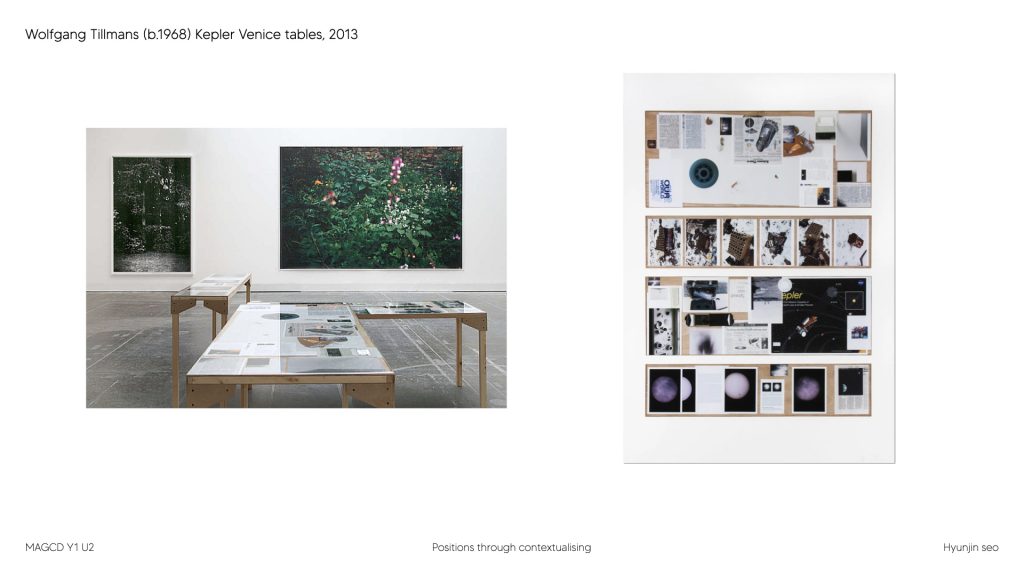
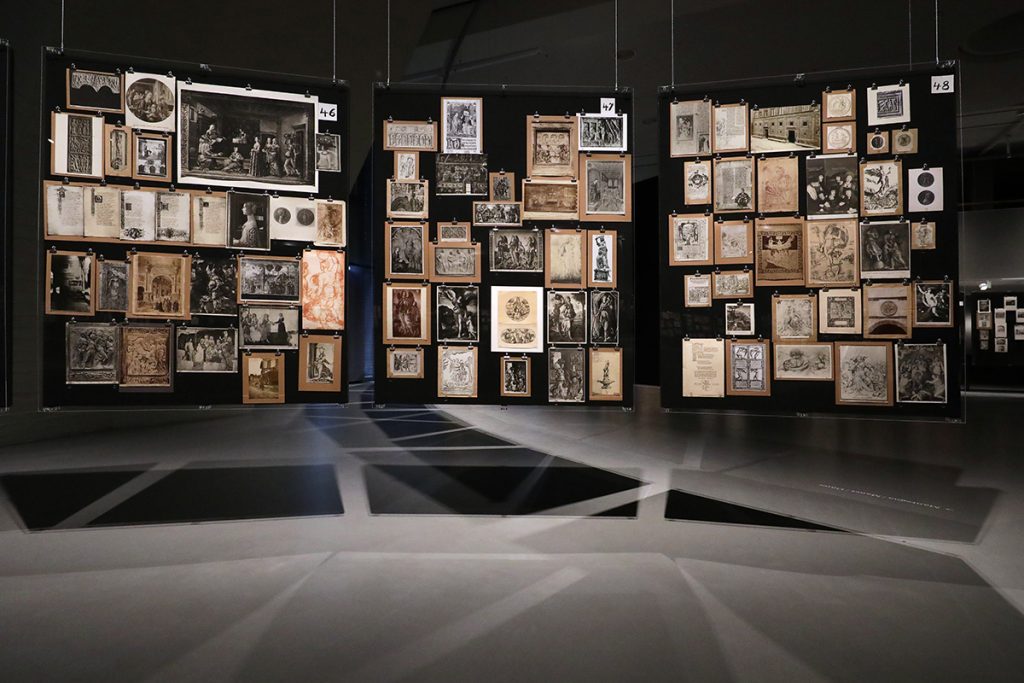
Looking at the venice table by wolfman gang’s venice table I started to think about how I can make the audience to look after what has been left behind, to search for, uncover, and reveal. To find what the institution chose not to keep.
Working at a museum, I photographed one of the display cases, a Victorian specimen case titled “FORE LIMB OR WING.”
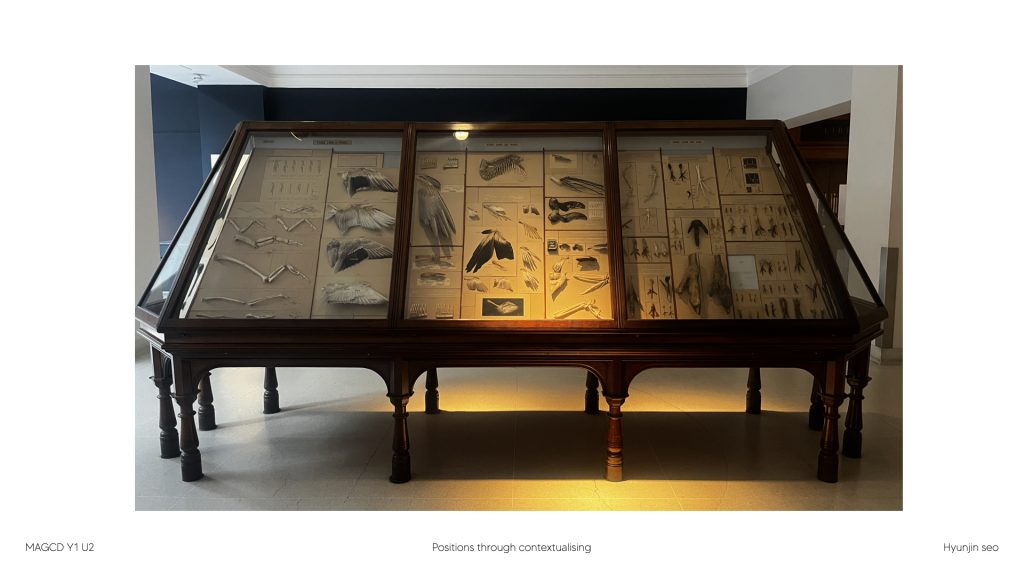
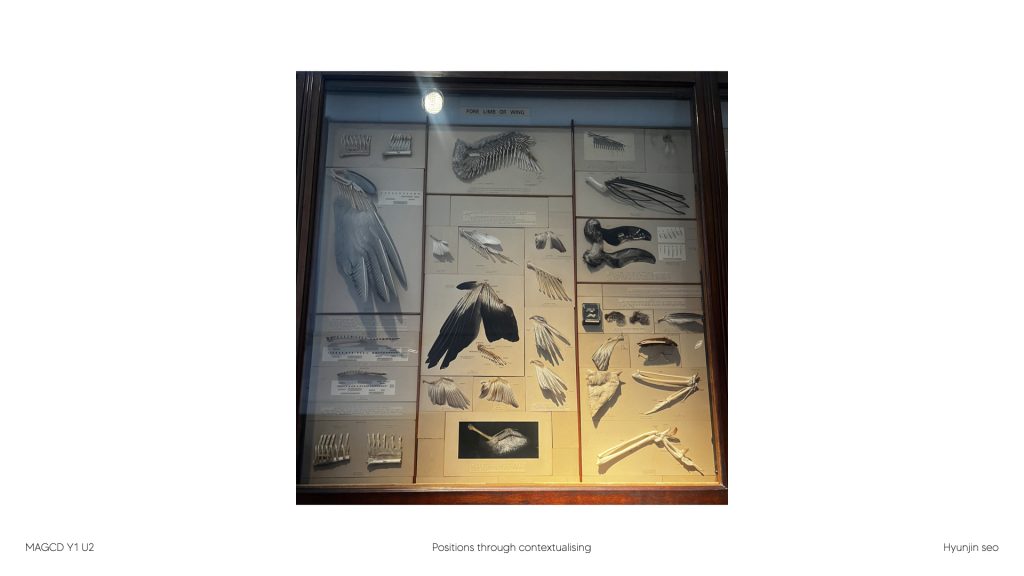
Objects pinned down, labelled, arranged behind glass. A life reduced to a caption.
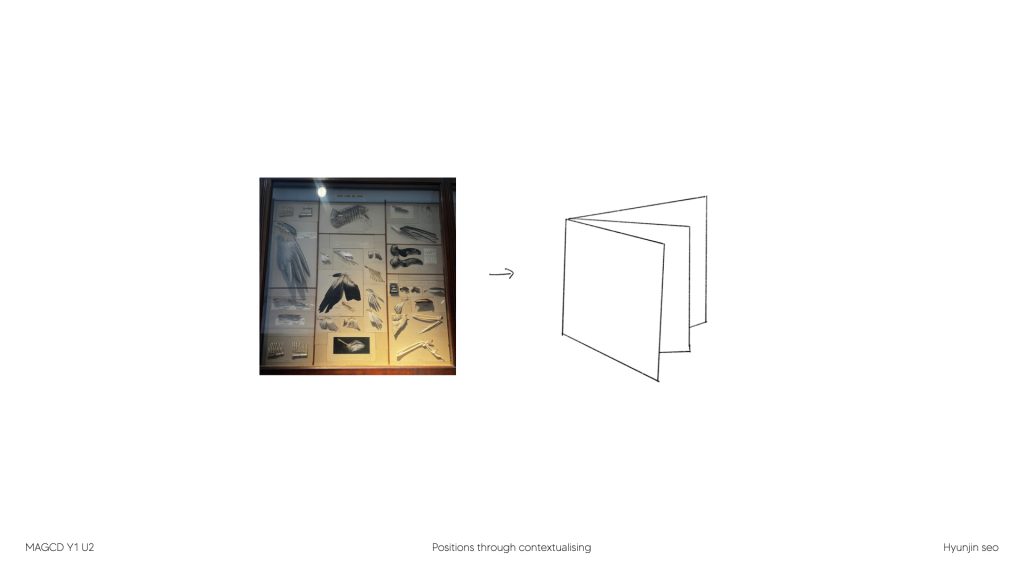
This image became the starting point for my method: folding.
I wanted to reconstruct the flattened heritage into a living narrative by transforming the static archival system into a dynamic, ‘folding’ process that synthesises fragmented data into a functional organic whole.I started to explore this idea with a single sheet of paper, folded, cut, and layered, that functions as both a display case and an archive.
On the surface, it looks exactly like an official exhibition. Authoritative. Complete. The kind of display a national museum would be proud of. But the folding structure means it can be opened. And the act of opening is itself a critical gesture. The audience doesn’t passively view, they physically break the institutional surface to reach what lies beneath. Each layer has a title that shifts as you go deeper.
Unfolding each Layers
Layer 1: Those Who Are Remembered — the official surface. Recognised figures, formal captions, state-approved narratives.
Layer 2: Those Who Are Not Remembered — the same people, but the cracks begin to show. The same figures, the same spaces — but what the institution chose not to say.
Layer 3: Those Who Refused to Be Remembered — critical fabulation. Voices that were never recorded, written in the absence of a record. Based on Saidiya Hartman’s concept: filling the gaps with imagination, but never hiding that it is imagination.
The Stories
I started to do some research on Korean historical figures, who were represented by Korean Institution, and explored how they were presented. Then, I started to look at their stories that were not selected by the institution to be presented.
I then tested this the folding structure across four stories I found.
The first is the comfort women grandmothers and the House of Sharing. On the surface: a sanctuary, a symbol of remembrance, 155 Statues of Peace installed worldwide. Underneath: of 8.8 billion won raised in donations, only 200 million reached the survivors. A devout Catholic grandmother was given a Buddhist funeral against her wishes. Her belongings were left in a car park, covered in plastic, in the rain. The story the institution told and the story the grandmothers lived were not the same story.
The second is Park Cha-jeong. On the surface: a recognised independence activist, awarded the Order of Merit in 1995. Underneath: her gravestone does not bear her name as an activist. It reads, Wife of General Yaksan Kim Won-bong.Fifty years of suppression because her husband defected to the North. The critical fabulation: a revised gravestone. The one that should exist, but doesn’t.
The third is Yu Gwan-sun. On the surface: the most perfectly flattened figure in Korean history. One photograph. A few lines. A complete heroic narrative. Underneath: she was virtually unknown before liberation. She was selected for the textbook because someone was looking for a Korean Joan of Arc. Her image was used by the Park Chung-hee regime to justify nationalist unity. On the day of her protest, there were 3,000 people at Aunae Marketplace. One name was recorded. The rest became a crowd.
Lastly, Its all the activist who refused to be represented as an ‘Official Independence Activist’ as they felt like they were being used for political purposes.
Here is the final outcome:
Feedbacks
Positive
- Critical fabulation’s visual quality is really strong.
- Cosidering my position within the practice is also very strong. evolving nicely and differently.
Negative
- Maybe having actual physical object? documents that folds out?
- Consider having both Korean and English. Two audience have completely different understanding of these subject. Maybe having different captions?
- Information density & richness is a lot, but maybe there is too much story? consider how I can use graphic communication design as a tool to making it interesting
- Something about Museum display makes it more easy for audience to embrace all the information on the spot and all of them are the ‘Wings’.
- Materiality super important. How I might present this to people, visual language. How do i want it to feel and come across.
- Consider adapting Korean typeface.
- Rachel Emily Taylor — Heritage As Process: Constructing The Historical Child’s Voice Through Art Practice.
-
Positions through Contextualising: Written Response
Bibliographical entry with a short statements:
1. Blauvelt, A., Maurer, L., Paulus, E., Puckey, J. and Wouters, R. (2013) Conditional Design Workbook. Amsterdam: Valiz.
Initially, I deeply explored an analogy based on DNA transcription and translation to redefine my understanding of a “system.” I mapped my great-great-grandfather to DNA (the inaccessible origin), the archives to mRNA (extracted fragments), and my role as a designer to the Ribosome, synthesising these elements into a protein (the living narrative). I was fascinated by how DNA remains inactive unless it is read, translated, and physically folded through interaction. However, I recognised that the highly technical, biological complexities of DNA computing and origami were becoming too overwhelming and rigid, distracting from the human stories at the core of my practice. Consequently, I shifted away from the literal scientific framework and turned to the Conditional Design Workbook. Blauvelt’s manifesto—“The designer no longer designs the final form, but designs the conditions in which forms can emerge”—perfectly rescued the emotional and participatory core of my DNA experiment without its technical baggage. It allowed me to transform what initially felt like a cold, rigid system into an open, reactive environment. Through this shift, my accordion book ceased to be a static display; it became a set of formal conditions where the narrative is only activated, de-flattened, and felt when the audience physically engages in the act of unfolding.
2. Taylor, R. E. (2020) Heritage As Process: Constructing The Historical Child’s Voice Through Art Practice.
Taylor’s concept of “curating as looking after” provides the methodological foundation for my practice. By identifying how institutional captions at the Foundling Museum erase the individual voices of children to construct a sanitised history of “childhood,” Taylor demonstrates that heritage is not a fixed monument but an ongoing process. In my project, I translate her framework from an institutional workshop format into a physical editorial mechanism. While Taylor works within the museum space, I operate outside it, searching for what the state deliberately chose not to keep. Her focus on reconstructing lost voices through creative practice validates my use of folding as a tangible strategy to uncover the personal narratives crushed by administrative classification,
3. Kim, Y. (2023) Badangbat (Sea Field): Manifesting Intangible Cultural Heritage through Illustration.
Kim’s practice-based research expands my understanding of illustration not merely as decoration, but as a “cultural generator” and an interpretive bridge between generations. Her work with the fading Jeju language and Haenyeo culture utilises drawing during interviews and workshops to capture lived experiences that formal archives overlook. This directly enhances my studio work by repositioning my drawing style as a critical tool. Kim proves that visual representation can synthesise verbal fragments and emotional nuances into a tangible form. In my project, I adapt this approach to move beyond a cold, scientific presentation of historical victims. Instead, I use drawing to bridge the gap between historical alienation and modern empathy, turning illustration into an innovative method for sustaining memory as a living, breathing entity.
4. Suh, D. H. (2019) The Bridge Project.

Suh’s ongoing exploration of the “perfect home” through migration and memory challenges the rigid boundaries of national and political archives. By unfolding deeply individual yet universally relatable spaces, Suh demonstrates that private architectural or domestic memories can serve as arenas to interrogate geopolitical displacements. This directly informs the physical and emotional architecture of my accordion book. Suh’s work validates my decision to map out the “stolen futures” and private spaces of my subjects, such as a quiet room filled with family photographs. It stretches my practice by showing that the meticulous reconstruction of private, micro-historical spaces can become an experimental, engaging method that invites the audience to recall their own domestic warmth, thereby confronting macro-historical absences.
5. Tan, S. (2006) The Arrival. Arthur A. Levine Books.
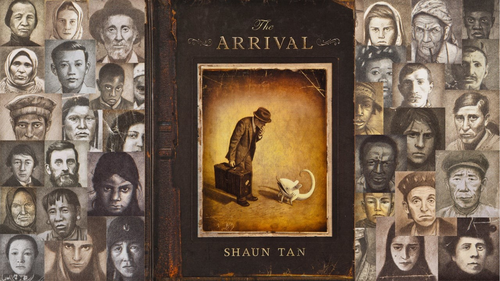
Tan’s wordless graphic novel profoundly altered my approach to information management by introducing the power of “sensory compression.” His opening sequence of silent immigrant portraits establishes an immediate, deeply human connection before any narrative context is given, proving that emotion can bypass historical alienation. Confronted with the overflow of traumatic data in my research on ‘Comfort Women,’ I learned from Tan that listing every bureaucratic violence only dilutes the impact. Instead, Tan’s method pushed me to isolate a single, sensory “stab”—such as the cold imposition of a state-mandated Buddhist funeral over a private Catholic faith. By adapting Tan’s logic, my Layer 1 portraits establish an empathetic, wordless entry point, leaving gaps that invite the audience to perform their own critical fabulation.
6. Hartman, S. (2008) ‘Venus in Two Acts’, Small Axe, 12(2), pp. 1-14.
Hartman’s theory of “Critical Fabulation” acts as the conceptual anchor for Layer 3 of my structure. Her practice of writing into the blank spaces of the transatlantic slave archive, playing with white space, imagining what could have been said, without ever concealing the lack of an actual record, directly guides my illustrative restorations. Hartman challenges the graphic designer to resist the urge to neatly “fix” history or falsify a happy ending. Instead, she teaches me to use soft, distinct pencil lines to signify that Layer 3 is a restorative, speculative space. Her text deepens my practice by framing imagination not as a fabrication of historical untruths, but as an ethical, creative intervention designed to return human dignity to those whom the official state archive left entirely unrecorded.
7. Warburg, A. (1924–1929) Mnemosyne Atlas.
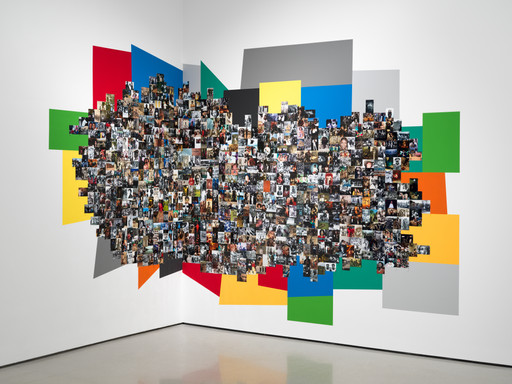
Warburg’s unfinished iconographic constellation challenges the linear, institutional categorisation of historical timelines. By pinning disparate images together across different eras, geographies, and themes, the Mnemosyne Atlas creates a visual laboratory where memory behaves as a dynamic, shifting energy rather than a static record. This expands my line of enquiry by justifying my role as a “visual facilitator” who assembles fragmented archives. Warburg’s associative layout directly informs my use of the accordion structure, allowing the five historical figures in my book to coexist within a giant, virtual family photo. It strips away the state’s clinical chronological divisions, enabling the audience to map out cross-temporal relationships between separate instances of institutional control and personal resistance.
8. Tillmans, W. (2009) Kepler Venice Tables.
Tillmans’ Venice Tables project uses large, flat display surfaces to assemble newspaper clippings, personal photographs, and found texts, subverting the traditional authoritative voice of the museum vitrine. While institutions use display cases to classify objects into permanent categories, Tillmans uses the table format to create a democratic, unstable grid where high politics and everyday ephemera carry equal weight. This heavily expands my critique of the natural history display case (“FORE LIMB OR WING”). Tillmans’ practice provides a visual counter-strategy: by mimicking the flat, authoritative arrangement of official documents on my book’s surface, I create a visual alibi of state control, only to destabilise it completely once the physical folds are pulled open by the viewer.
9. Tenen, D. (2017) Plain Text: The Poetics of Computation. Stanford University Press.

Tenen’s media-theoretical exploration of “literature down to a pixel” introduces a profound connection between physical surfaces and hidden administrative layers. He argues that plain text is never neutral; it is always bound to a hidden material, computational, or political infrastructure that formats and flattens human expression. This stretches my critical enquiry by allowing me to equate computational flattening with bureaucratic flattening. Tenen’s insights justify my focus on the physical forms of modern state applications, grades, and certificates. It reframes my book design not merely as a container for text, but as a material critique of “formatting” itself, showing how state institutions use standard paperwork to compress raw, chaotic patriotism into flat, manageable archival data.
10. Hugh, S. (Created by) (2022) Pachinko. Apple TV+.
The television adaptation of Pachinko provides a masterful reference for navigating the “divided audience” and the multilingual burdens of Zainichi/Korean history. The series utilises colour-coded, trilingual subtitles (Korean, Japanese, English) to visualise the invisible borders of language, identity, and displacement. This directly inspired the structural orientation and linguistic roles of my book. Pachinko demonstrates that historical trauma cannot be consumed equally by all viewers. By observing how the show uses cinematic language to navigate cultural proximity, I resolved to use the physical orientation of my folding book to segregate my audiences, keeping the internal pockets of “untranslatable”모국어 (mother tongue) whispers exclusively open to the Korean accomplice, while offering poetic sensations to the international viewer.
11. Metahaven (2015) Sunshine Unfinished, in Black Transparency: The Right to Know in the Age of Mass Surveillance.
Sunshine Unfinished is an infographic designed along the logic of the game ‘Snakes and Ladders,’ tracing the concept of transparency across politics, philosophy, and architecture from 109 AD to the present. The title alludes to Justice Louis Brandeis’s famous quote that “Sunlight is said to be the best of disinfectants,” a metaphor for how visibility can “cure” social diseases. This reference challenges my practice to think about the visual rhetoric of illumination. In my project,the “Official Surface” (Layer 1) functions like Metahaven’s sunlight, a curated visibility that claims to be “complete.” However, Metahaven’s use of the game logic reveals that transparency is often a power play of visibility and concealment.This deepens my understanding of how a diagrammatic timeline can be used not just to show information, but to critique the conditions of how that information is made visible or hidden by institutional power.
12. Kwami, A. (2015) Grace Kwami Sculpture [Leporello/Concertina Artist Book].
Atta Kwami’s Grace Kwami Sculpture is a tribute to his mother, Ghanaian sculptor Grace Salome Kwami. The work is a leporello (concertina) bound book designed to unfold and stand on its edge, resembling the eight legs of the spider Ananse from West African folktales. This reference was the pivotal physical “solve” for my studio outcome. It shifted my thinking from a flat digital layout to a three-dimensional “reactive object.” Kwami’s work demonstrates that a book can function as a sculpture that occupies space and requires a specific physical engagement. I adapted this logic into my “Pocket-Accordion” structure, where the folding is no longer just a way to save space, but a physical manifestation of the gaps and creases within the historical record.
Extended critical analyses of two of the references: one text and one project (500 words)
Analysis 1: The Practical Project
Taylor, R. E. (2020) Heritage As Process: Constructing The Historical Child’s Voice Through Art Practice. [Practice-Based Research / Curation Project at the Foundling Museum, London]
In her practice-based doctoral research at the Foundling Museum, Rachel Emily Taylor conceptualises “Heritage as Process,” interrogating how institutional museum captions overwrite the historical voices of marginalised orphan children with a sanitised narrative constructed by adult administrators. Rather than treating heritage as a static monument, Taylor positions it as an active, continuous performance. By facilitating workshops where contemporary children engage in role-play and making, she dynamically reconstructs historical voices through multiple contemporary interpretations. This methodology shifts across formats: from archival investigation to social engagement documented via “Field Notes,” and finally to a radical spatial subversion, curating the children’s fragile artefacts back into the museum’s physical display cases. This creates “ensemble voices” that challenge monolithic historical curation, mobilising the Scottish definition of curating: “to look after.” Formally, this commitment is made visible through tension between institutional register and the personal, the children’s uneven, unfinished outputs sit inside the same vitrines as polished historical artefacts. The form enacts the critique.
Engaging with Taylor’s work completely reoriented my project. I had mistakenly believed my work was a cold, genealogical reconstruction of my great-great-grandfather’s journey, leaving me conflicted between emotional storytelling and rigid system-thinking. Taylor’s framework made me realise I was actively engaging with the politics of heritage. Examining my family’s materials, I noticed my great-great-grandfather’s “true voice” was entirely absent, only eighty fragmented slips of paper in classical Chinese and Japanese, records generated by colonial administrations, governments, and descendants. His identity was already flattened by visual communication formats, languages, and political filtering, confirming that flattening is inherently embedded in the historical process, produced by the tension between state protection and institutional control.
Moving beyond my family narrative, I recognised this structural flattening across modern Korean history, where recording itself acts as institutional power. This erasure spans three overlapping groups excluded from the state’s official vocabulary: unrecognised activists whose covert or gendered resistance lacked documentary proof; figures whose recognition was distorted or weaponised, such as Park Cha-jeong, defined on her gravestone merely as a general’s wife, or Yu Gwan-sun, flattened into a textbook trope while three thousand fellow protestors were reduced to an anonymous crowd.
I translate Taylor’s methodology into a new medium through folding. While Taylor operates within institutional boundaries, curating missing fragments back into the museum space, my translation critiques the museum system itself. Through a pocket-accordion structure, folding becomes a resistive gesture, the audience must physically open the surface to navigate three layers: the authoritative Layer 1, the distorted Layer 2 archive, and the Layer 3 space of Critical Fabulation. Taylor’s multiplicity of voices guided the structural dualism of my book: inner pockets unfold in opposite directions by language, keeping untranslatable Korean emotional truths inaccessible to the English-facing side. For me, Taylor’s definition reframes curating not as preservation but as excavation, actively uncovering what the institution chose not to keep. What is not recorded is not absent. Its absence is the record.
Analysis 2: The Text
Blauvelt, A., Maurer, L., Paulus, E., Puckey, J. and Wouters, R. (2013) Conditional Design Workbook. Amsterdam: Valiz.
Andrew Blauvelt and colleagues define the core proposition of Conditional Design as follows: “The designer no longer designs the final form, but designs the conditions in which forms can emerge.” This shift repositions the graphic designer from author to architect, from someone who delivers a fixed outcome to someone who constructs a set of rules, constraints, and relationships within which meaning can be actively produced by others. The Conditional Design Workbook formalises this as a practice, presenting a series of process-based exercises that foreground the system over the result. The formal qualities of the book itself reinforce this position: its diagrammatic instructions, process-oriented language, and deliberately open-ended outcomes resist the idea of a singular, authoritative reading. The workbook does not show you what to make. It shows you how to make conditions for making.
This framework directly challenged and clarified my own practice. At the beginning of this project, I was building a rigid system and positioning it as the core of my work, a fixed structure that would organise fragmented historical narratives into coherent form. This felt cold and reductive. Engaging with Conditional Design helped me understand why: I had conflated the system with the outcome, when the system should function only as a set of conditions. The pocket-accordion structure I developed, a physical object that unfolds in opposite directions depending on the reader’s language, revealing three conceptual layers, is not the work itself. It is the condition through which the work becomes possible. The audience must physically open the surface. They must choose a direction. They must decide how far to go. The narrative does not exist until they produce it.
However, my work also complicates and partially inverts the Conditional Design proposition in a way I find more honest to my practice.
In Conditional Design, the system is the fixed element and the outcomes are open. In my project, this relationship is reversed in one significant respect. My illustration style, which had always functioned as a flexible, intuitive tool across my practice, became, in this project, a fixed rule. I drew all four portraits using the same materials, the same tonal register, the same formal language. This was not a spontaneous decision but a structural one: the visual consistency of the portraits functions as a system in itself, preventing information overflow, creating coherence across five separate historical narratives, and allowing the audience to immediately understand that these are not unrelated stories but variations of the same condition. Like Louis Agassiz’s fish catalogue, where visual uniformity across species created the illusion of objective classification, my portraits use stylistic consistency to create the illusion of an official, authoritative exhibition, before the folding breaks that surface apart.
What Conditional Design gave me was permission to trust the conditions over the content. What my practice added back was the understanding that sometimes the most powerful system is not the structure you build, but the visual language you choose to hold constant. The flexible became fixed. The fixed became a tool. The system did not produce the work. It produced the conditions for the audience to produce it themselves.
-
1. My Snippet: Flattening
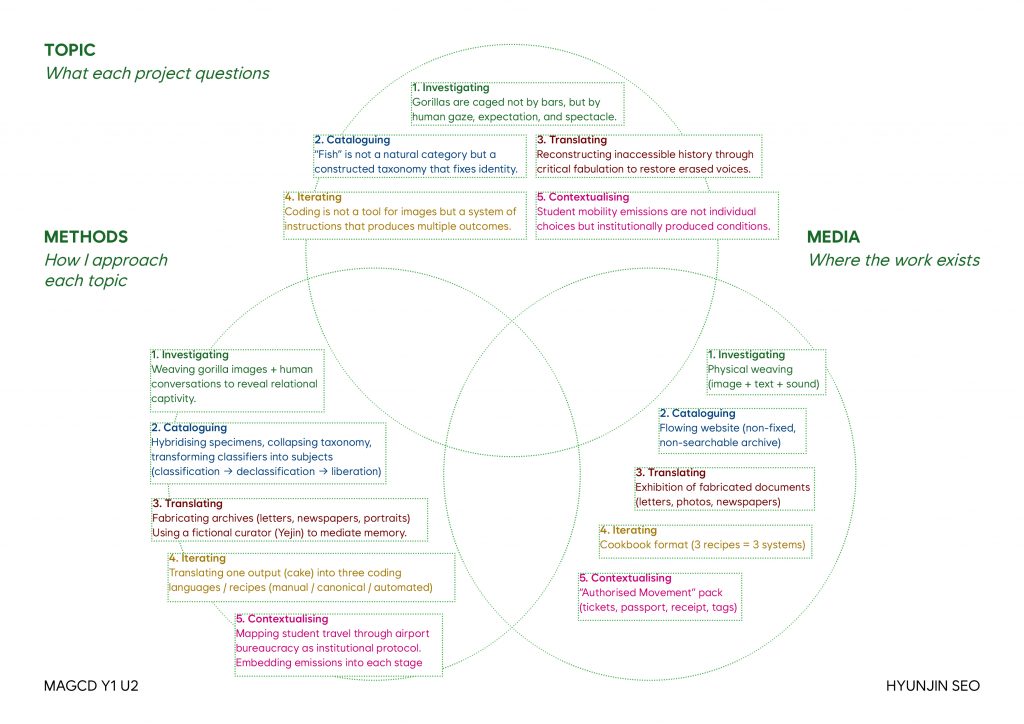
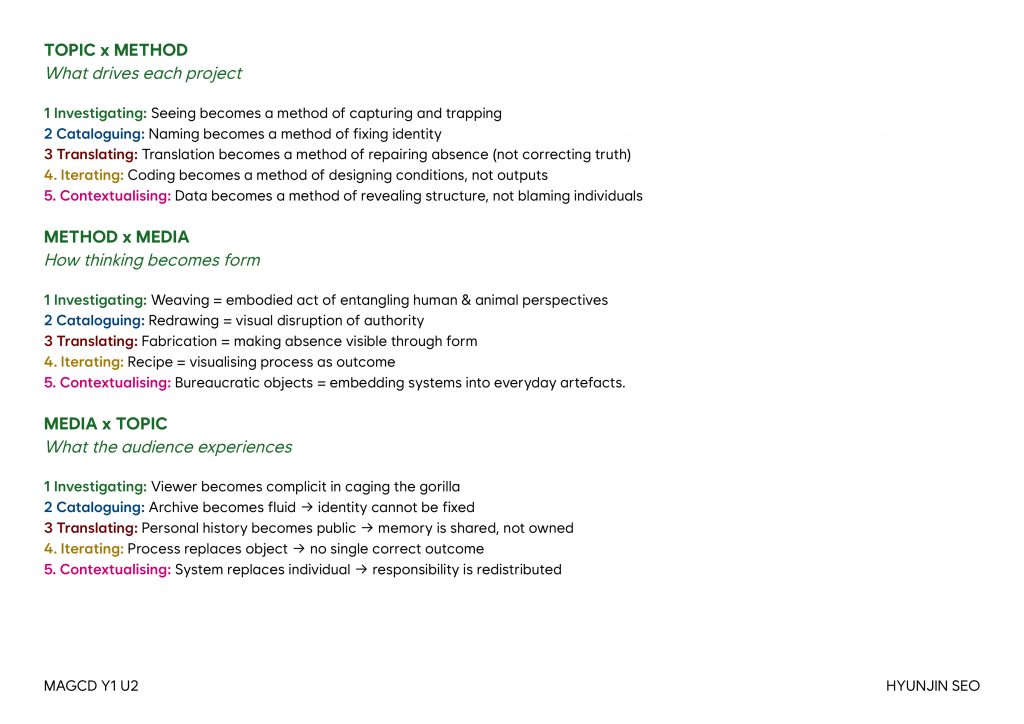
To begin this project, I started by evaluating my previous projects from unit 1, using the provided van diagram and examine my practice into three big categories: Topics, Methods, and Media.
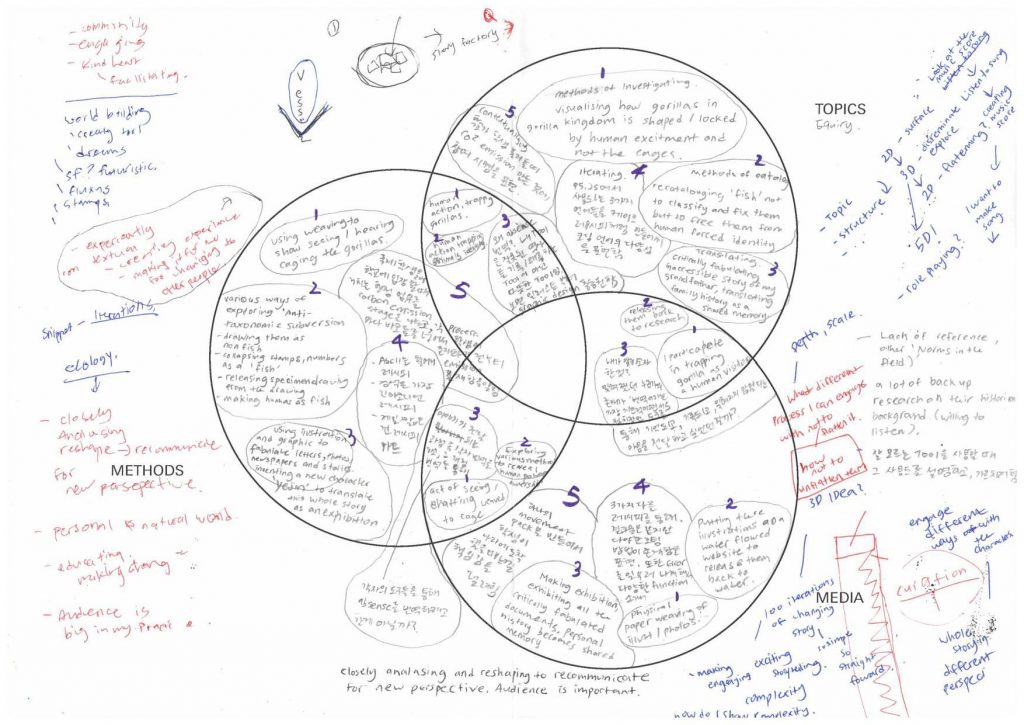
Through this process, I noticed interestings overlaps in my practices.
I am not an image maker, but a structural translator
→ My work does not represent visible subjects,
→ It reveals hidden systems of power and structure- Gorilla Kingdom → Not about animal rights but spectatorship structure.
- ‘Fish’ → Not about living matters but about taxonoical power structure.
- My great great grandfather → Not about personal story but about historical record power structure.
- Cake coding → Not about the outcome but about the production system structure.
- Movement pack → Not about the action but about the institutional mobility structure.
→ Not visualising what is visible, but revealing what is hidden behind how it is framed.
Empathy as a tool
My tool, graphic design, is not a detached instrument of observation, but a mediator that comforts and preserves the memories of family histories and marginalised beings. I defined translation as both a deeply personal and inherently political act.
Reconfiguring responsibility
→ My work does not deliver information
→ It repositions responsibility- Animal is not trapped → we built the system
- Fish is not real → we named it
- Carbon is not personal → system demands it
- Archive is not truth → someone authored it
→ Core question: Who is responsible?
→ Outcome: Responsibility is redistributed
OVERLALL:
Up until now, my practice has been about moving beyond the surface of a subject from a two-dimensional understanding into a three-dimensional one. I analyse a topic, uncover its underlying structures, and use visual and empathetic tools to translate that complexity. Through this, I aim to reposition meaning and redistribute responsibility. But I began to notice a consistent problem.
Then, I started to spot some habits in my practice that are problematic.
→ Across all projects, I:
- Analyse surface → uncover structure (2D → 3D)
- Translate structure through visual tools
- Produce outcomes that reposition meaning and responsibility
BUT
→ The final outcomes become flattened representations
- Complex research → simplified visuals
- Layered experience → single output
- Process → reduced to result
This became especially clear in my Methods of Translating project. I worked with over 80 archival materials,
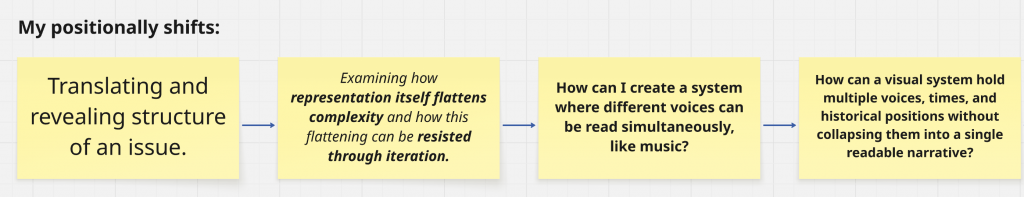
and used critical fabulation to reconstruct missing histories. However, I realised that I was pre-determining the emotional experience for the audience. Instead of allowing them to feel the process, I was suggesting what they should feel— which meant I skipped the experience itself. At the same time, the fictional granddaughter as curator remained a surface-level device, rather than a critically grounded position. So in the end, I was flattening the very experience I was trying to preserve.This led me to a shift in focus. I became interested in flattening as a condition of representation itself.
What gets removed when we represent something? What becomes readable, but less felt? And more importantly, can flattening be resisted, delayed, or even undone?
So instead of simply producing outcomes, I began to investigate this question:
Critical enquiry
How complex histories are flattened through representation, and how this flattening can be resisted or undone.
Iteration Zero (Starting Point)
To begin this investigation, I return to one of my previous outcomes the auditory map from Methods of Translating.
I chose this because it already contains time, voice, and emotion. But even here, these elements are still partially flattened. So this becomes my testing ground. A site where I can examine my own act of translating, observe how flattening occurs, and experiment with how it might be undone.
Therefore, My practice shifts from translating structures to examining how representation itself flattens complexity—and how this flattening can be resisted through iteration.
Iteration Unflattening:
Started to expand all the records, stories and photos needed to create the auditory map.
Iteration flattening:
Then, I deliberately push the process of flattening to its extreme.
- Starting from the original materials, I selectively extract certain pieces of information and through this act of selection, the story begins to become a map. As the process continues, the narrative is progressively compressed.
- I layer everything on top of each other, erasing emotional tone so that only cold, factual information remains.
- Events are reduced into icons, where the richness of the story disappears into symbolic form.
- Time is converted into numbers, removing the lived experience of duration and transforming it into data.
- Finally, the entire narrative is condensed into a single sentence— an extreme form of flattening.
This led me to an important realisation: Flattening is not just the result it is already embedded in the process.
As mapping suggests, “mapping begins with selection, and selection is already flattening.” The moment I choose what to include, what to edit, and how to represent something I am already flattening its complexity.
Iteration Unflattening:
Restore time and narrative to what has been flattened.
Through this process, I investigated how experience, emotion, and structure contribute to the formation of a multidimensional story. What begins as a simple experiment evolves into a mode of investigation.
By re-expanding the meanings altered through flattening—examining what was removed, shifted, or newly produced—the work tests whether a flattened narrative can be reconstituted into a layered, spatial, and relational form once again.
While I was experimenting with unflattening, I started to do some research on non-flat story. A non-flat story is not linear, not singular, and not resolved. It accumulates, overlaps, and resists closure.
So I decided to test the further with iterations on Non-linear time and Accumulation.
-
Positions through Iterating: Written Response
2 references drawn from the course reading list that situate your project in a broader discourse or conceptual domain.
- Tenen, D. (2017) ‘Literature down to a pixel’, in Plain Text: The Poetics of Computation. Stanford: Stanford University Press.
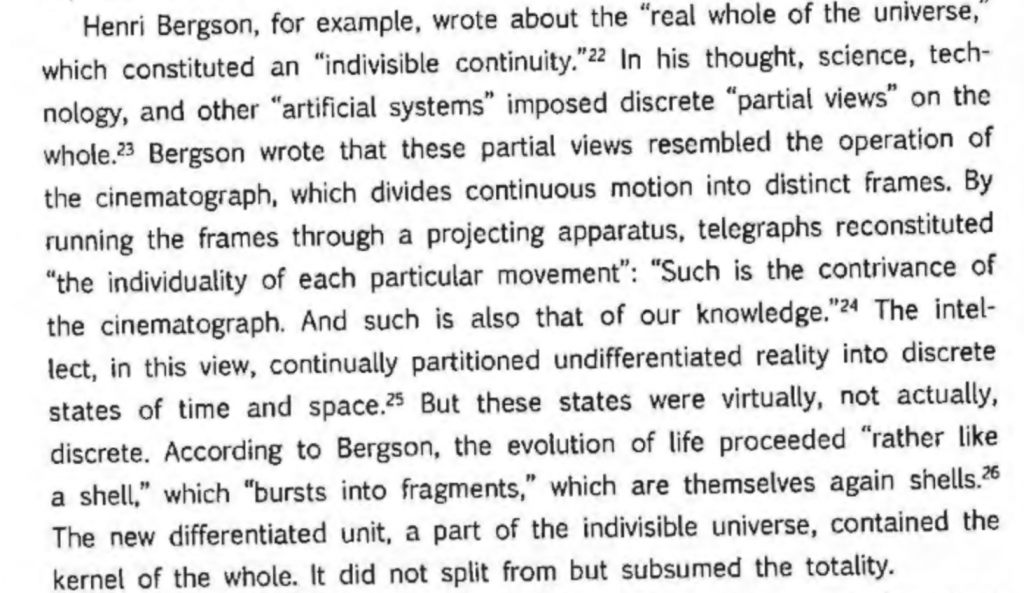
This text reframes my understanding of perception as an active process of reconstruction rather than passive reception. Drawing on Henri Bergson’s idea of the universe as an indivisible continuity, it suggests that what we perceive as discrete units are in fact partial views imposed onto a continuous whole.
In my Methods of Translating project, I fragmented my great-great-grandfather’s story—pausing and dividing a continuous narrative into temporal and spatial segments to make it legible for an audience. However, these fragments were never isolated; they remained deeply entangled with the larger whole. This reference helps me understand that such fragmentation is not simply a representational strategy, but a fundamental condition of perception itself.
Bergson’s rejection of the “flashlight model” of perception, where attention selectively illuminates reality, resonates strongly with my practice. Instead, perception operates through repetition, comparison, and accumulation. Building on this, my current Position through Iterating explores the structures of transformation itself, designing systems where narratives are not fixed but continuously formed through processes of breaking, layering, and recombining.
- Blauvelt, A., Maurer, L., Paulus, E., Puckey, J. and Wouters, R. (2013) Conditional Design Workbook. Amsterdam: Valiz.
“The designer no longer designs the final form, but designs the conditions in which forms can emerge.” (Blauvelt et al., 2013)
This text shifts my understanding of design from producing fixed outcomes to constructing open systems. It proposes a transition in authorship: from designer as tool user to designer as tool-maker, or even as a designer of conditions that enable others to act. Rather than determining form or meaning, design operates through relationships, feedback, and distributed agency.
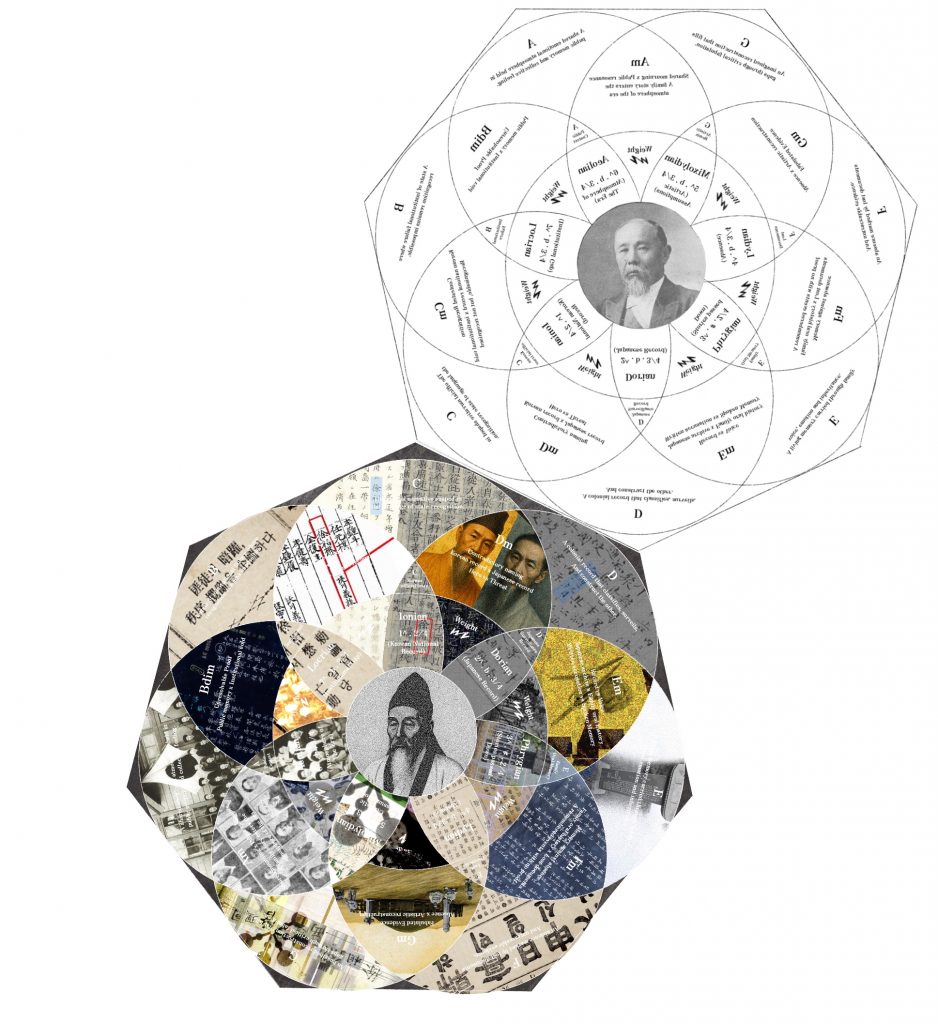
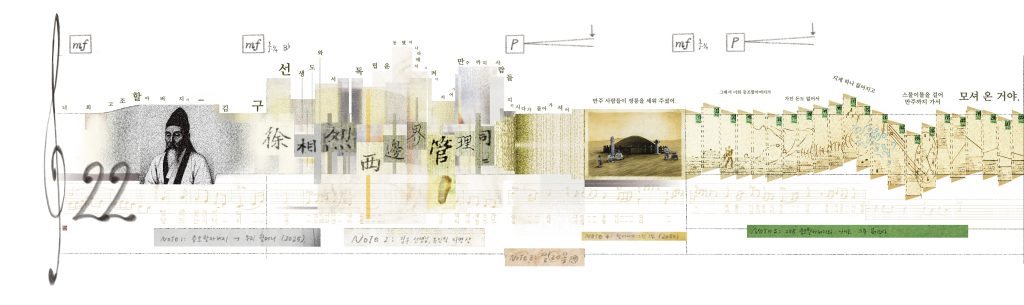
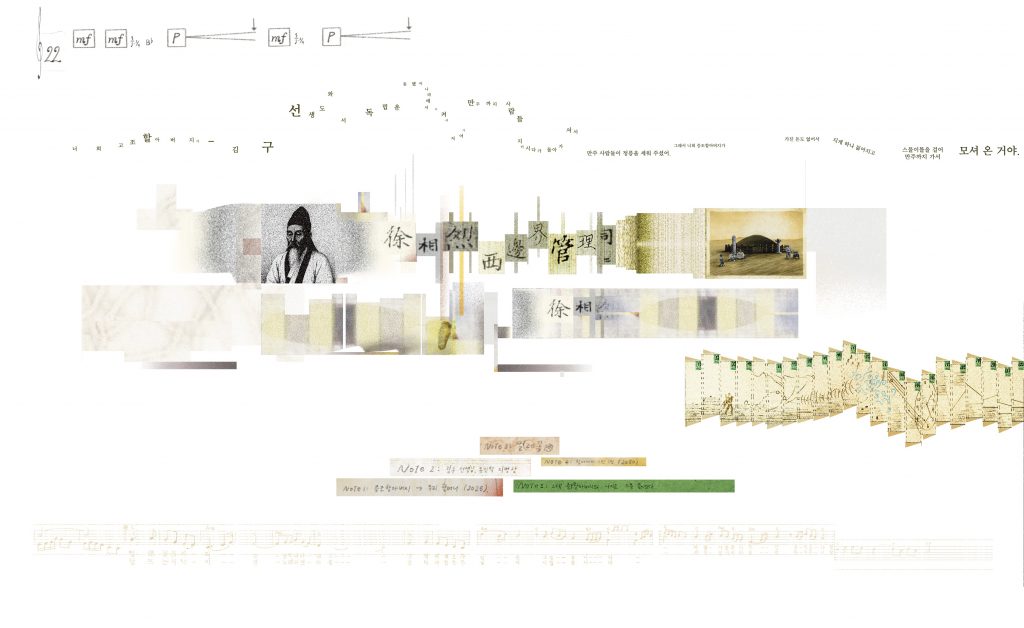
This directly informs my current Positions through Iterating project, where I move away from producing singular narratives toward building systems that allow multiple stories to coexist. By introducing a “music theory tree” structure, I translate musical logic into a narrative system: major notes become central figures, modes act as perspectives, and chords represent the collision of viewpoints. This framework resists the flattening of complex histories into a single, linear account.
Instead of presenting a resolved interpretation, I construct a platform in which narratives are continuously generated, layered, and recombined. In this sense, my role shifts from authoring meaning to designing the conditions through which meaning can emerge.
1 reference that is specifically related to your project in its topic (theme or subject matter)
- Pachinko (2022) Created by Soo Hugh. Available at: Apple TV+.
“History has failed us, but no matter.” (Pachinko, 2022)
Pachinko situates my project within a broader discourse of diasporic identity, generational memory, and survival under historical violence. The series traces the lives of Koreans living under and after Japanese colonial rule, foregrounding how displacement, family ties, and historical conditions shape personal identity across generations. Its narrative resonates closely with my own exploration of my great-great-grandfather’s story, particularly in its attention to inherited trauma, resilience, and the emotional complexity of belonging and estrangement.
However, what distinguishes my practice from Pachinko is its narrative structure. While the series powerfully delivers emotional depth through a cohesive, linear storyline centred on Sunja and her family, it ultimately consolidates multiple experiences into a singular narrative arc. This produces immersion, but also limits the coexistence of conflicting perspectives.
In contrast, my work seeks to resist this narrative convergence by constructing systems in which multiple voices, contradictions, and temporalities can exist simultaneously. Rather than telling one story, I design conditions where stories remain open, fragmented, and relational.
1 reference that is specifically related to your project in its medium or method
- The Library of Babel (1941) by Jorge Luis Borges.
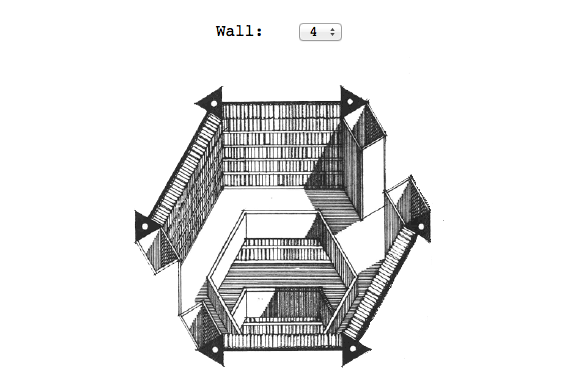
“The universe (which others call the Library) is composed of an indefinite, perhaps infinite number of hexagonal galleries.” (Borges, 1941)
In The Library of Babel, Jorge Luis Borges constructs a universe not from matter, but from books, endless hexagonal rooms filled with every possible combination of letters. Meaning does not reside in any single text, but emerges through wandering, misreading, and accidental encounters. Truth is not given; it is assembled.
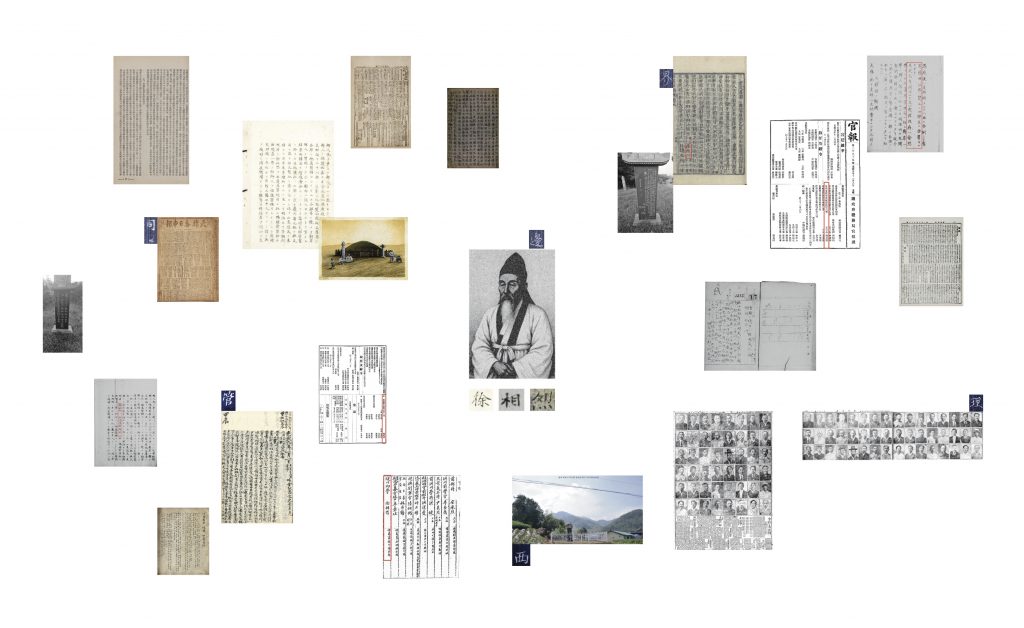
This logic closely informs my Positions through Iterating. If Borges builds his universe from books, mine is built from perspectives. Each voice, across nations, generations, and positions, functions like a volume on a shelf, partial and situated. Together, they construct an unstable but expansive understanding of a single figure: the independence activist.
Unlike linear narratives that guide the viewer toward one interpretation, my system invites navigation. Meanings shift depending on where you stand, how far you move, and which voices you encounter. Like Borges’ library, it contains both truth and fabrication—archives and imagined reconstructions, intentionally entangled. I am not telling a story; I am building a space in which stories collide, echo, and continuously reconfigure.
1 reference that demonstrates a critical position in context of your specific topic, medium, or method
- Templo (c. 2021) Interconnected Disaster Risks Visual Identity. Collaboration with United Nations.
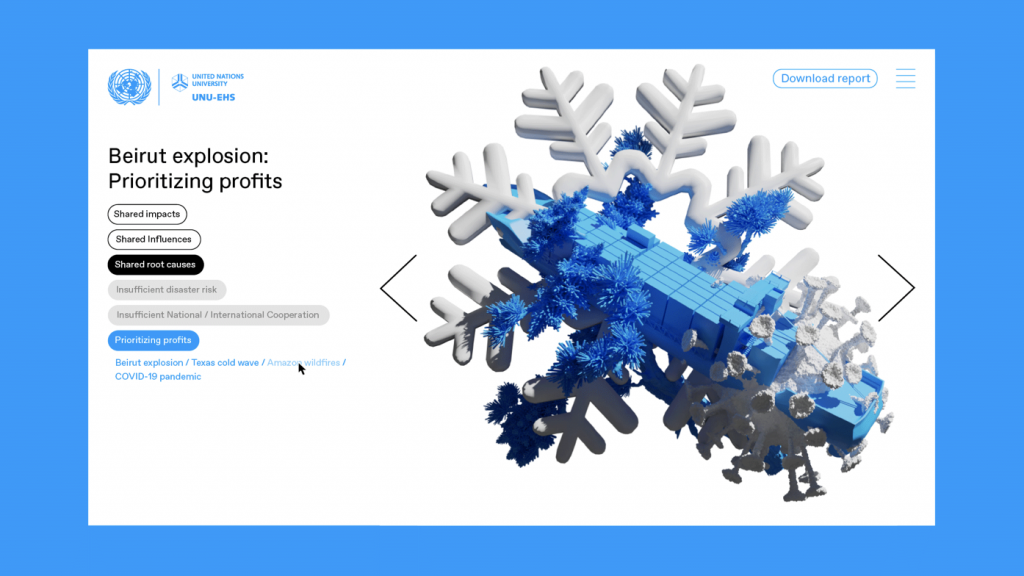
The collaboration between Templo and the United Nations offers a critical model for visualising complexity without reducing it. Rather than presenting disaster events as isolated incidents, the project maps them as interconnected systems, revealing shared underlying causes through spatial “collisions” of 3D forms. This approach resists the simplification of global crises into singular narratives and instead foregrounds relational structures and systemic responsibility.
This is directly relevant to my practice, where I question how narratives become flattened through selection and representation. While traditional storytelling often isolates events into linear, digestible forms, Templo’s work demonstrates how meaning can emerge through accumulation, overlap, and interaction. Their use of topology as a visual language aligns with my interest in designing systems where multiple stories coexist and inform one another.
In my Positions through Iterating, I similarly construct frameworks, such as the music theory tree, where perspectives intersect and reshape each other. Rather than guiding the viewer toward a single conclusion, I aim to expose the underlying structures that connect seemingly separate narratives.
1 wild card reference (identify another type of relationship, or re-use any of the above prompts)
- Problems of Dostoevsky’s Poetics (1929) by Mikhail Bakhtin.
“A plurality of independent and unmerged voices and consciousnesses.” (Bakhtin, 1929)
Mikhail Bakhtin’s concept of polyphony provides a critical lens through which I understand my shift away from singular authorship. In a polyphonic structure, multiple voices coexist without being subordinated to a central, authoritative perspective. Each voice retains its autonomy, creating a space where meaning emerges through dialogue, tension, and coexistence rather than resolution.
This directly informs my Positions through Iterating, where I resist constructing a unified narrative and instead design systems that allow perspectives to remain distinct yet interconnected. Drawing from musical polyphony, I think of narratives not as linear progressions but as simultaneous layers, voices that overlap, diverge, and occasionally collide. In this structure, no single viewpoint is privileged or resolved into a final truth.
Rather than acting as an omniscient author, I position myself as a facilitator of relations, enabling interactions between voices across time, geography, and identity. My work, therefore, becomes less about telling a story and more about sustaining a condition in which multiple stories can speak, coexist, and continuously reshape one another.
A short statement (100–200 words) that articulates your line of enquiry. What questions are you exploring in this project, and how are you exploring them? Be as focused and specific as possible. (Tip: Don’t try to write this during the first week. Wait until your iterations have developed meaningfully.)
My project begins with a critical reflection on my practice as a structural translator rather than an image-maker. While I analyse topics to uncover underlying systems and translate them through visual and empathetic tools, I noticed a recurring contradiction: although my process engages complexity, the final outcomes inevitably flatten it into readable representations.
This led me to question flattening not as a byproduct, but as a condition of representation itself. What is lost when we make something legible? What becomes visible but less felt? And crucially, can flattening be resisted, delayed, or exposed rather than avoided?
Using the auditory map from Methods of Translating as a testing ground, I examine my own acts of translation to observe how flattening occurs and how it might be undone. Through iteration, I discovered that non-flat narratives are not linear or singular, but accumulate, overlap, and remain unresolved.
This shifted my enquiry toward system-building. Drawing on musical structures, rhythm, repetition, layering, and polyphony, I ask: how can multiple voices be experienced simultaneously without collapsing into one? My aim is not to eliminate flattening, but to design a navigable system in which it is delayed, revealed, and actively resisted.